This webinar demonstrates how Baron Weather’s advanced meteorological technology integrates with WebEOC Nexus to enhance emergency management and incident response capabilities. Dan Gallagher from Baron Weather explains how their company has served over 50,000 customers across multiple industries for over 35 years, providing specialized weather data layers including radar, severe weather tracking, and impact-based forecasting. The presentation showcases Baron Weather’s unique capabilities such as decluttered radar feeds that update every two minutes, StormIntel Polygons for tracking severe weather with precise timing, and specialized datasets for hail paths, damaging winds, and flash flood risks. Matt Cronin then demonstrates the WebEOC integration, showing how users can overlay multiple weather data layers on interactive maps, access real-time conditions, and integrate weather intelligence directly into their emergency management workflows. The webinar emphasizes how this partnership eliminates the need for emergency managers to jump between different platforms, providing comprehensive weather situational awareness within their existing incident management system. The session includes live Q&A covering topics like Canadian data availability, integration requirements, and various weather data applications for different regions and use cases.
Transcript:
from forecast to action, unifying weather intelligence and incident management.
Before we begin, just a few housekeeping items.
This session is being recorded and will be shared with all registrants after the event.
All attendees are muted by default to minimize background noise.
Please submit questions anytime during the event. Use the QA panel for that. We’ll address these questions live as time allows and follow-up on any we miss at the end.
If you’re experiencing technical issues, try refreshing your browser or just leaving and re rejoining the session.
We’re gonna prompt two poll questions during this event. We would love your feedback on these poll questions.
Today’s webinar will last about forty five minutes, and we’ll send the recording and a short survey to all registrants following the event.
Our agenda today, we’ll welcome today’s speakers. We’ll get an introduction to our partner, Barron Weather. We’ll get an overview and the benefits of the Barron Weather product, and we’ll see a demo of that product.
Then we’ll get a demo of Barron Weather integrated within WebBLC.
We’ll talk about our future webinars, how to get more information, and we’ll wrap up with questions.
Today’s speakers, Dan Gallagher, is a meteorologist and solution engineer with Barren Weather. Dan holds a bachelor’s and master’s degree from Saint Louis University and brings experience as a forecaster, researcher, and business leader in the weather industry.
Dan has spent nineteen years at Barren Weather and holds a patent for his research and currently works with organizations to improve safety and efficiency across public safety, retail, construction, and more.
Dan has also served in leadership roles with the National Weather Association.
Matt Cronin is VP of solutions engineering here at Chewari, and I’m Jeff Erkovich, director of partnerships at Chewari.
Before we move on to our first, part of the, webinar, I’d like to prompt our first poll question.
How does your organization currently access weather intelligence during incidents? It will take about a minute to to get your feedback on this. Much appreciated.
Looks like we’re getting some excellent feedback. Thank you.
Okay.
Great. Thank you for that for that feedback. Much appreciated. With that, I’ll turn things over to Dan Gallagher to kick things off. Dan?
Alright. Thank you very much, Jeff. Thank you for your time, everyone. Hopefully, you enjoy this webinar and find it useful.
If I were to summarize what I’m gonna speak about today in just one simple succinct statement, it’s that Barron Weather exists to simplify the decision making process when weather’s gonna impact your organization. Everything that we do is geared towards that. And we’ve been doing it for for a long time, over thirty five years. We are a global weather company.
We’re based in Huntsville, Alabama, and we make an impact around the world. Chances are you’ve benefited by barren weather without even knowing it. We have over fifty thousand customers across many different industries. Everyone’s impacted by weather just in different ways, and so we have a lot of technology and information that we share to improve that decision making process.
We have a lot of advanced technology. We have over a hundred exclusive weather data layers covering real time and forecast weather information to help you throughout the process.
And our technology doesn’t stop at just data and visualization. We actually also build radars. As a matter of fact, we are the weather provider that upgraded the National Weather Service to their current radar technology, something called dual polarization. And so we have a lot of experience in this area, and we are able to make a lot of derived radar products because of our in-depth knowledge of what’s inside those radars. So special expertise, that we have, and you are the beneficiary.
Our whole mission is to protect people and places, and we have many datasets that can help you do that. And we are dedicated to the science. We have meteorologists in all different roles throughout our organization, from our CEO all the way on down and in between. We have the science at the forefront, and we’re always advancing in making sure that we have the latest and greatest to help you. And, of course, that’s backed by great customer service. We wanna be able to back everything that we do and make sure that you are empowered to make decisions, based on our technology.
So just talking about some of the industries that we serve.
We have a place in many different industries. So agriculture, for example, we have datasets having to do with, things that can cause crop damage, you know, hail and damaging winds. Aviation, we have clients who are, major airlines, airports, and flight planners and flight tracking websites. So we have a major presence there, turbulence, icing, you name it. Broadcast media, that’s where we got our start over thirty five years ago. That is still a core part of our business today.
And so that’s one of those ways that you’ve probably benefited by Barron is all the advanced storm tracking that the TV meteorologists are doing on television. That, a lot of that is Barron technology. And now we’ve taken that same technology and put it into WebEOC Nexus so that you can benefit in your roles as well. Construction, wind data for crane operations, energy and utilities. We have, for example, a forecast of freezing rain on power lines specifically applied to that industry.
Government, you know, a very broad spectrum, but everywhere from, you know, state and local, and all different entities, emergency management, transportation, many, many different, areas in government.
Insurance, obviously, for claims, maritime, safely getting from point a to point b on a boating vessel, public safety, whether it’s disaster response, nine one one dispatch, emergency management, of course, retail, knowing where to, have resources prestaged. For example, landfalling hurricane, and then transportation. What’s the impact of weather on the roadways? So we can serve many different industries, and I will try and approach that here, on a case by case basis here.
So in terms of the benefits, number one, it’s that enhanced situational awareness. We wanna help you prepare for ahead of time with our forecast datasets, know exactly what you’re up against, what is the threat, how bad is it going to be. And then we are able to have a lot of real time datasets to help you through the event as well. And with it being integrated into WebEOC, it makes it easy. You don’t need to jump anywhere else for that information. It’s all integrated into the products that you’re already using.
And the goal, of course, is improve decision making. And the way that we do that is we simplify the weather process. We break the weather down into individual elements and have data that’s very highly local. For a municipality, for example, you don’t want a general synopsis of what the weather is for your entire community. You wanna have a granular look at what parts of my community are impacted cause it can really vary.
So that is how we can improve the decision making process.
And then lastly, increased operational efficiency. We want you to have this data all in one easy to use platform that you’re already using to communicate and coordinate resources. We don’t want you to have to jump anywhere else. So this partnership between Jabari and Baron Weather, is very important in the whole process from the preparation to the response to the recovery.
And then some details on the data itself, some of the key benefits. We do have a vast catalog of weather. I mentioned we have real time and forecast weather elements over three hundred different weather data layers, that you can pick and choose from from our catalog. It is highly local. We’ve got it down, in some cases, to street level so you can make decisions, based on, your assets or parts of your community.
We also have many unique data layers. We have I mentioned a few of them when I was talking about the industries, about how we apply weather data to specific scenarios for enhanced decision making, whether it’s ice on the power lines or the results of weather on the roadways. We have a lot of unique data layers in addition to many that you’re accustomed to from National Weather Service such as watches and warnings and local storm reports. We provide all those to you, but we can enhance it with our own offerings.
I’m a meteorologist, but most of our customers are not. And so we want to make sure that we’ve done the analysis and interpretation for you. And so that is a key components of our data offerings.
Everything that we have is state of the science. We wanna make sure that we’re leveraging our expertise and then passing that on to you so that you can make the decisions that you need to.
And lastly, we’ve been doing this for a long time. We’ve been doing this for over three decades now. We’re not some startup, and we have many accomplishments that we’re proud of and happy to share with you.
So we’ll go ahead and move on to the demo phase here, and I’ll go ahead and share my screen.
Alright. So you should be seeing a, an image of radar over the US, which is real time data. This is happening right now.
And I’ve actually got two different data feeds on here. And the reason why I like to start with this is that many people are accustomed to seeing radar. Perhaps you have an app on your phone or you’ve watched, you know, news coverage of, you know, weather going on. And so it’s a pretty common data layer, but even with the common data layers, Barron is able to add value.
And so, I’ve got two feeds. The one on the left here is public feed available, and then the feed on the right is the barren feed. And I’ve got this swiper tool. And you’ll notice here as I move across here, the barren feed, there’s a lot of data on the right that’s disappearing. And, no, that’s not a bad thing.
The reason that that’s happening is that we are decluttering in near real time. Radar everything you see on radar isn’t necessarily precipitation. There are a lot of a lot of artifacts that can happen. And so with the feed from Barron, we wanna give you confidence that what you’re seeing is actually precipitation.
So we are able to clean that in near real time and provide that to you. Another element that you’ll notice is a little bit of a difference between the color palettes there, and that’s because our feed does differentiate between precipitation types. So those white and blue colors that you see are snow. We have pink colors for freezing rain and sleet, and then, of course, the more traditional, colors, for liquid precipitation.
But it’s so important knowing, especially in a winter weather event, as we’ve had, recently over the past few weeks or so, knowing what type of precipitation that is because that can impact your response.
Our data does update much more frequently than is publicly available as well, every two minutes as opposed to every fifteen minutes on a lot of public sources. And then lastly, and it’s something that I can’t necessarily show on a map, but definitely deserves mention, and that is the reliability of the data. We are able to scale with demand. When the weather’s at its worst, that’s when you need it the most.
And, unfortunately, those public sources get overwhelmed when the weather is at its worst. And so you’re counting on data that you need to make decisions and relying on the public sources is not there. With Barron, we have, many, many, backup and redundancies in place. We’ve mastered the art of distributing weather information, And so that is a characteristic that, will benefit you because we will have that data quickly and reliably for you when you need it.
So those are some of the characteristics just of radar data, just one of our datasets where you benefit, with, our advanced technology and experience.
And I mentioned earlier the need to break the weather down into individual components to make it easier to understand.
And so I’m gonna go from live data to an archive case here. This is an example in, Alabama and Georgia here. And what we’re looking at is radar and watches and warnings, which is good, and that’s a necessary part of what you need.
But even that requires analysis and interpretation. I think that you can probably look at the reds and purples on the radar and know that something bad is happening there. But what is it that you need to prepare for? Is it heavy rain?
Is it damaging wind? Is it hail? Even a National Weather Service watcher warning like those orange polygons that you see on the screen there, those are severe thunderstorm warnings. Even those require a bit of analysis and interpretation because it can mean, for example, wind speeds fifty eight miles per hour or greater, or it can mean hail and intragreator, or it can mean the potential for a tornado.
And so our goal is to simplify that process and give to you dedicated layers that you have that will add clarity and allow you to respond appropriately. So one example of that is we have one layer that is just hail. It’s hail path. It updates every five minutes as the event is unfolding, and you’re able to see, for example, first of all, if hail is an impact. And if so, where is it in the community? So we’ve gotten rid of everything else from the radar except where there’s hail, allowing you to see, if there is, something that you need to respond to. If there if you have, you know, an ambulance, a fire truck, something like that that, you don’t want damage and you have the opportunity to move out of the way, this dataset will give you that, ability to do so.
By the same theory, we have something called damaging wind path. Again, it updates about every five minutes as the event is unfolding.
And so this will allow you to see, first of all, if damaging wind has occurred, and if so, where did it occur? You’ll also notice a red polygon on the screen, and that is a National Weather Service tornado warning. National Weather Service did a great job with this in terms of the timing of the warning, but you’ll notice the green and red colors here, is our damaging wind path. The impacted area is much smaller than the warned area. So first of all, you wanna make sure that damaging wind did happen. And then if so, you want to allocate resources to the impacted areas as soon as it’s safe to do so. And this will give you that ground truth without having to rely on reports coming in from the media or the general public or others out in the field.
And then lastly, the last element of the storm that was significant was a flash flood risk. And so we have a data selection called flash flood risk, which is a Nowcast, and Nowcast is simply a forecast for the short term.
And this will assess your risk. If you look at the legend on the right, this will tell you whether your flash flood risk is elevated, high, or very high, and it breaks it down into thirty minute segments through the next two hours. And it’s very highly localized. The National Weather Service flood watch, for example, oftentimes that will be county based and is valid for, say, the next twelve to fourteen hours. And so with this, you’re able to see it on a much finer spatial resolution and kinda have those shorter fuse, warnings so that you can take appropriate action, proactively close the roadway, get assets out of harm’s way, and then know where exactly you need to move into, to, help your community.
So those are ways that we go from this radar and watches and warnings where you need analysis and interpretation to individual layers that will help you identify the threat and respond appropriately.
One other technology that I’d like to showcase here is, something that we originally started for television stations, and now you have the same technology available in WebEOC Nexus, and that is our StormIntel Polygons. I I like to call this our cheat code for severe weather. It is meant to, first of all, identify the threat, tell you where it is now, where it’s going, and when it’s gonna be there. So in other words, we’re providing all the actionable information that you need to make decisions without having to be an expert in radar analysis.
So if you look at the legend on the right, we categorize it into different elements. So those different elements of a severe thunderstorm warning, for example, we’ve got those, and we’ll individually call those out whether it’s just a regular thunderstorm, hail, high winds, large hail, tornado. So we have identified the threat, tell you where it is now, where it’s going. And then if you look at those lines in that polygon, those are times of arrival in five minute increments.
So you’re able to see when it’s going to arrive, and have that all integrated into, WebEOC Nexus. And these polygons, these they look similar to a National Weather Service warning, but they’re not. It’s based on our own proprietary technology, our own algorithms, time tested. Again, this is what the TV meteorologists are using to track the storms with to the minute arrival times in your communities.
And these are updating every few minutes as well. So that’s a key difference between this and, for example, a National Weather Service warning, which is plotted on the map, and it’s there until until it expires. So if you’re on the far end of that polygon, you’re getting lots of lead time. If you’re on the front end, though, you’re not getting as much because ours are updating every few minutes with the storm. Everyone’s getting more equitable lead time, and we’re able to kinda change if the weather changes, if it’s gone from a hail threat to a tornado threat. Our polygons, our storm hail tell polygons will evolve with that. So when it comes to severe weather, this is a fantastic tool for you to use in your decision making process.
I’d also like to talk about hurricanes for a moment as well. We have many different tools. We have highly localized data to help with those decisions. You know, hurricanes are massive systems with many different impacts.
And so what I’d like to show is Helene, and one of the datasets that we have available is a wind speed. Now you’ll notice the wind speed that we have here, they’re not dots on a map. In other words, it’s not just where there’s an observation at an airport. We’re filling in all those gaps in between using a scientific method and updating that frequently.
So not only are you gonna have nationwide coverage and highly local coverage, but you’re gonna have data that is frequently updating as the event is unfolding. And one thing I’d like to point out here with Helene is that, if you look at the, the track here and then these purple colors heading into the Big Bend of Florida, those were the highest winds, but Helene wasn’t known necessarily for the winds that it produced, but rather for the flooding and rainfall. And as you move further inland into the Western Carolinas and Eastern Tennessee, you look at those those magenta, purple, pink colors, red colors there, are the higher rainfall amounts.
And so it was much further inland, but this is the same storm but producing different impacts depending on where you’re at. And so while the Big Bend of Florida had the winds, the rain, it transitioned primarily into a rain threat. And so that is data that we have available that’s updating every few minutes as the event is unfolding, for your decision making process. You know, what to prepare for, where to prestage assets, and where you need to go into as the weather impacts you.
So many different impacts, and these are available as current conditions with nationwide coverage and worldwide coverage, by the way, as well. We do have a data layer called rapid analysis, which is the exact same thing.
Updates every five minutes for every point in the world. So, we do have that information available as well. And a couple others I’d like to share, we want to make sure again that we’re doing the the impact for you so that you know exactly what’s going to happen.
So we have, for example, road conditions. So I’ll show you an archive example here.
So what’s the impact of weather on the roadways? It’s not always obvious. We’re tracking many different factors so that you can see, for example, if the result of weather on the roadway is is flooded or wet, patchy ice, ice, snow, heavy snow.
So we are tracking that, and it updates, every five minutes. So you always have a really good assessment of what that is. We also have road condition forecast, which goes seventy two hours into the future.
And, the last one that I will, show here talking about impacts of weather is the power outage information. And so, there just recently within the past week, there were some some ice storms and winter weather in the southern US. The impacts of that is still being seen today, through this power outage. And so, this is live. This is what’s going on right now. So there are still communities, for example, in Mississippi where there are over fifty or sixty percent of the population without power. And so, we provide you not only the weather data, but the impacts of weather transportation and and infrastructure and such.
So, yeah, so with that being said, I I think Matt is up next to show you about how that integrates, with, WebEOC.
Thank you, Dan. I’ll just take back the share.
Excellent. Okay. So what I’d like to do is present our second poll question at this time. So please take a moment and give us your feedback. Which weather data products are the most critical for day to day operations?
If you go ahead and give us your your input on these questions, we’d really appreciate it.
Great. We’ll go about thirty more seconds. Thanks for your input once again.
Alright. Looks like we have input from everyone. Thank you very much.
I’ll close that poll out.
And I’d like to turn things over to Matt Cronin to talk about the integration between Barronweather and WebEOC. Matt, take it away.
Thanks, Jeff. Yeah. So with the integration with WebEOC, you really can take that powerful data that that Dan showcased with, the various layers that they have available and bring all that data and insights, very easily into WebEOC, in the dashboards, in the workflows.
And this spreads across, you know, hurricanes, winter weather, wildfire, power outages. I mean, there’s just an immense amount of data layers as as you saw from from his presentation. But, yeah, let’s go ahead and dive into it, rather than show slides. Let’s, let’s jump into a live demo. I’m gonna go ahead and share my screen.
And can you see my screen, Jeff?
Not yet. There it is. Great.
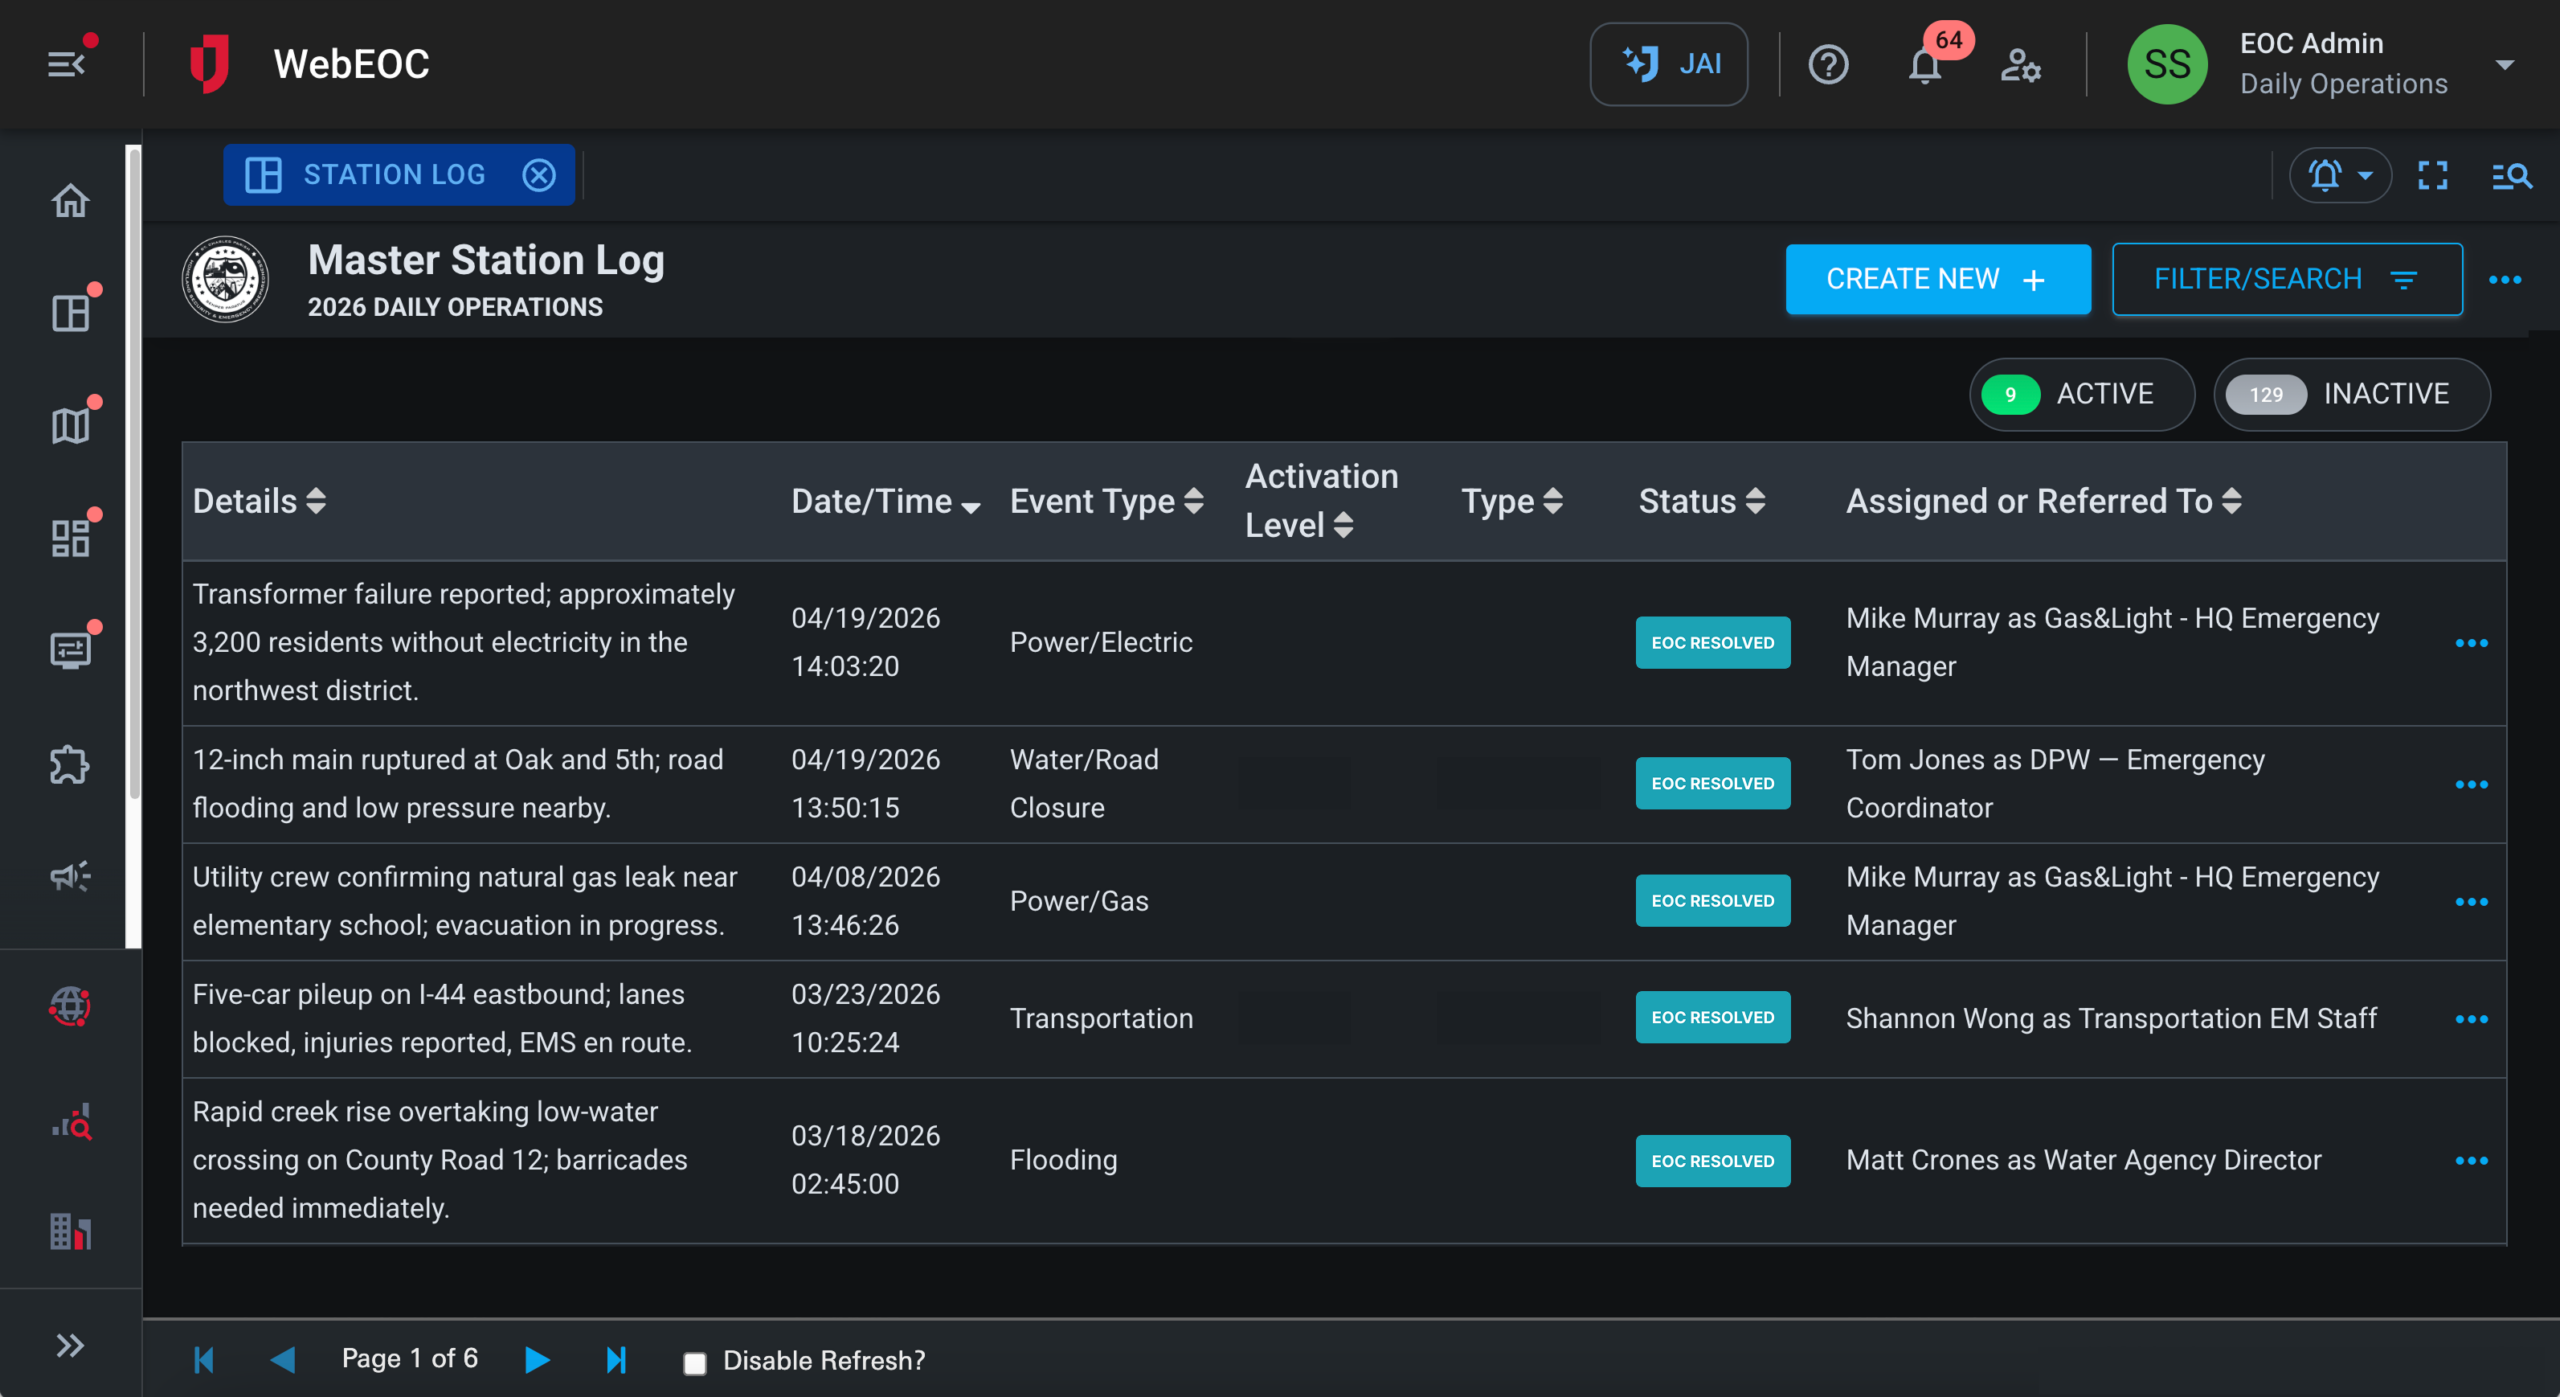
So this is the WebEOC Nexus environment.
If if folks haven’t seen WebEOC in a while, this is the latest and greatest of what, our our users get, you know, turnkey, today. And with this homepage or kinda cockpit, you can access, you know, your alerting, your your maps. I’m gonna dive into a bunch of them, your workflows, whether it be your dashboards. In those dashboards, you can have your data along with, various layers, within those dashboards.
You also have things like your, you know, managing requests and tasks and checklist. All of that also have, embedded map capabilities so you know where these items are geospatially, and you can add whatever, things like the store mental polygons layer, for example, shown here of what those impacts are and even drill into any of these, to see the underlying data of of what we should expect with these, with this information. So it can be in dashboards. It could be in workflows.
And, you know, as mentioned, it can also just be in in maps. In WebOS, you can create any number of maps. There’s different preferences in terms of I’ll show a variety of maps with different content, but there’s no reason why it couldn’t just be one map if that was, you know, if that was the preference. So you have the option of of either things.
Right? And so with this particular map, this is the data that Dan showed, with the impacts to the to from hail. Again, you can drill into that data very easily and see the details behind it. You can also interact with your WebEOC records to see that, you know, a report was, you know, structural damage due to facilities, as part of that that hailstorm, right, in in Crewsville.
So you have that ability to overlay, any of your data, whether it be reports, whether it be requests, whether it be facilities, and then overlay any of those layers, within the the application here. And we’ll just walk through some other examples just to give, some some insights into some of the different things you can do. So, again, if you wanna do it from kind of a situational framework, you can do flooding and rain, see the different layers specific to that. Down here, you can, turn on and off, different layers, just by, you know, enabling or disabling these.
This also will allow you to change the opacity of these layers so you can, and this is by the end user. Of course, a lot of this can be set by the administrator in terms of what the default is, but then the end user can adjust any of those details as they want. They can see the legend to understand, you know, what do these values mean, and they can also click any of these, portions of of these, feature services or map services to be able to see the underlying data within it. You can also change, you have a lot of other map capabilities.
This is Esri based. Right? So it’s the, you know, one of the strongest mapping capabilities out there. You can change the base layer very easily.
You can say you wanna do some measurements. You can measure areas or distances. You can, you know, print the map to, an image or PDF. You can search the map.
So just a lot of capabilities around, what the user can do within these maps. Let’s look at just a couple more examples few more examples here. We might wanna look at, again, severe weather. So I have a map specific to that.
In this case, we’ve overlaid, our workflow that’s kind of indicating, the status of counties. So a lot of states will utilize this to see what the impacts are, where the counties report, whether they’re activated, And then you can see here, who’s activated, who’s not, who’s partially activated here. And then, again, this layer can be, enabled or disabled, and then we have our data, from that the storm intel polygons that I could drill into and click on that detail. And see, to Dan’s point, you can even click on these each of these segments of this, for that very detailed granular information of what what impacts, to to expect here.
So just very powerful, you know, whether that’s hail, whether that’s winds, whether that’s tornadoes, you can bring all that powerful data into this map and, again, overlay it with your your WebVOC information very easily. Just a few more examples here. Earthquakes. So, we can bring in earthquake data.
The size of the, icon kinda indicates the severity of that that earthquake. So just another layer that either could be, you know, in your all in one map or could be or be its own map as kind of we’re we’re showing here, where, again, the size of that icon represents the size of that that earthquake. So good good data around that. Also, some wildfire data, they also provide.
This one is a little not as much going on with wildfires right now, but, you know, you can you can kinda see the the small small polygons representing the the various wildfires that are happening.
You can also look at this data either today, if we, you know, look at today, or we can actually go back in time. So both WebUC, with our mapping capabilities and Verint have the ability to look back in time. And if I wanted to look back of what the situation was, in the past, I can actually just slide this and see what what was occurring at that that moment in time using, using kind of our time slider here that can be, optionally enabled on on different maps. The final thing, final example I’ll provide is, tropical weather. Very important, obviously, to the southeast.
Not a lot going on as it relates to that right now. But, normally, you know, during hurricane season, we have, you know, the spaghetti plots. We have the, you know, the tropical forecast. We have wind speed.
All those things that you would wanna, be able to track as it relates to to tropical weather, that’s very powerful during, during hurricane season, you know, here in the southeast. So, I’m gonna stop there and turn it back over to Jeff.
Thank you, Matt.
Okay. So my screen share back. Thanks for that.
Okay. We have some future webinars coming up. Our next one is with power outage on March fourth at noon eastern. We have a whole year of these webinars planned. So although you’re not seeing them here today on this slide, please know that there are more coming, and we will make some announcements in the near future.
To get more information, to learn more about anything you’ve you’ve heard today, you can reach out to me directly. You can request a demo, using the Jovari link there. You can reach out to Dan Gallagher directly with any questions, or you can visit our partner site to learn more about this partner or any partner.
We have a lot of questions, so I wanna dive right into those.
Let me see where we can pull up our questions here.
Bear with me just one second. Q and a. Okay.
First question, is Bear and Weather included with WebUC? Does it require a separate subscription? It’s an add on to WebUC, so something you would buy in addition.
It’s a it’s a SaaS model, so you would pay a monthly fee for that.
Would this be a function of JX in addition to WebEOC? Matt, I think I’ll ask you that question. That’s okay.
So this would not be a function of, JX or Javari Exchange. Javari Exchange is the mechanism that allows different WebEOCs to talk to each other and and have collaboration between organizations, you know, using their separate instances of WebEOC. So this wouldn’t be a function of that. This would be a function of our, GIS technology, the mapping technology that allows for overlaying, both Baron and a lot of other technologies, via that map sharing capabilities. So not as much a a function of JIX, more a function of the, mapping and GIS, capabilities that, that are included with WebEOC.
Thanks, Matt. Another good question. For customers who already have Barron Weather, are these features and options available? Yes. They are.
It’s a very simple addition of map layers, so we can help you with that.
I would reach out to your to your account executive, your your sales rep, and they can help you.
It’s it it really is very simple to to add this to to WebEOC.
Another good question, does the technology extend into Canada as well, or is this for US only? And I’ll I’ll defer to Dan on that one.
Sure. So we have some very specific Canadian datasets. The radar, for example, the north high resolution North American radar, covers the National Weather Service radars in the US and also the, Environment Canada radars. It’s it’s gonna be consistent whether it’s a US or Canadian radar, to where it’s the same color palette and everything.
It’s one unified look, one mosaic over both countries. We do have other Canadian datasets such as fire hotspots. So you can track live wildfires, in addition to a fire tracker technology, which shows where fires have burned over the past several, days, over through the past week. And then I mentioned we have a a newer, dataset called rapid analysis, which is a current conditions of various weather parameters such as temperature, wind speed, precipitation rate, things like that.
That covers every every inch, every centimeter, I guess, we’re talking Canada, over the entire world. They updates every five minutes. So so, yes, we do have a a great a great round of products for our neighbors in Canada.
There’s a follow-up. If we could show that we’re not gonna be able to show that today, but we’re happy to schedule a follow-up demonstration of that, Greg. Thank you.
Great. Next question. And I’ll stick with Dan for this answer. Can you put convective outlooks on the map?
So we do have, the storm prediction center outlooks, which, is a day one, day two, day three. And then furthermore so those are the convective outlooks. And then, typically, in a SPC convective outlook, you can also break it down into seeing where the tornado threat is, for example, damaging wind hail, and we do have those available, as well. So, yes, we do have that, government supplied storm prediction center convective outlook information available.
Okay. Next question. I live in an area that is at the edge of National Weather Service radars. Are you able to see the at a lower level, or do you have the same radar feeds? We relay we rely on weather spotters due to this.
So, yeah, that’s a great question. At Barron Weather, we we recognize, well, the industry recognizes, right, that, each type of weather observation, equipment, you know, has its limitations, which includes, you know, radar due to range and blocking to the terrain and things like that. And so for most of the datasets that we have available, we are taking a combination of different observation types. So ground observations, upper observations, radar, satellite information, and numerical weather prediction analysis, and combining the best of all of those different datasets to give you a an outcome that is, you know, as comprehensive as possible. So even in regions that are, you know, typically data sparse, we have data that will help in your decision making process.
Great. Going back to to Canada a bit, Dan, to add to Gerald’s question for Canadian prairie province provinces, can Barron provide the hail risk, current state, and forecast like demoed?
So for the hail path, for example, that would require, data that, from National Weather Service radars. So we don’t run the same hail algorithms on the EC radars, but we do have, forecast datasets, for example. We because we have forecast hail, and so that is available, with no differentiation between the US and Canada. So, yes, there are some drawbacks, and, yes, you’re gonna have better coverage where you do have a US radar for hail in particular. In other datasets, it’s there’s no difference between the US and Canada.
Great. Thank you. I’ll take this one myself. Is barren weather included in the Nexus package or available as with an additional fee? It is an add on to the Nexus package, so something you would purchase separately.
This question is about grants. I don’t know much about it. I’ll put the I’ll put the question out, and we may have to answer this one offline. Is there a Yeah.
There’s a question about what what grants might apply. I mean, certainly, for emergency management agencies, like emergency management performance grant, EMPG, SHISGAP, Homeland Security grant program, UOSI. There there there’s several different grants that, I don’t know if Dan has anything to add to that, but there’s definitely several grants out there that this would fall under potentially.
Yeah. I don’t, necessarily have anything to add just because there are so many different possibilities there in terms of grants.
Okay. And this one may also be too challenging, but I’ll I’ll put it out there. Can your system integrate hazard zone modeling for hazmat atmospheres, I e, Aloha?
So we don’t necessarily have an offering like Aloha. We do have datasets that could be used, you know, air we have many different datasets, you know, atmospheric models, air quality models, and and things like that. But, yes. Nothing is like a one to one replacement for that. And that’s a good question because a lot of, especially these days, a lot of, our our customers and government entities are asking for replacements for, federally funded data. And we in many cases, we do have it, but not all of them.
Great. Thank you.
Let me ask you one more. This is probably for Dan. Is integration based on or does it incorporate FEMA or other industry data exchange standards? Maybe that’s a Mac question.
Trying to wrap my head around that question a little bit. So, yeah, our data is, we have many redundancies built in. It’s built to work seamlessly in, WebEOC, to be distributed reliably and and with the advanced computing power necessary to provide that data as quickly as possible and reliably as possible.
I’m not especially I would say, you know, there’s there’s obviously a lot of standards out there for data exchange.
This Right.
You know, to be very clear, this is, leveraging, Esri technology. Right? We’re our mapping is Esri based, and Dan and Baron can provide these layers in Esri format, either in map services or feature services.
And so we’re using that, that format, that standard in terms of how that, data is being shared between the technologies. And I think anybody that’s aware of of that technology, can, you know, appreciates, how stable and what a good standard that is. So that that’s the method that we’re we’re utilizing.
Fantastic. Alright. Let me let me ask one more, and what I’ll do is I haven’t gotten to your question. It’s because it may be just a little too complex for this environment, but I will get back to you, with with the answers to your questions.
Does Barron Weather have a partnership with the National Weather Service?
So, yeah. So we do we work together very well.
And, obviously, you know, National Weather Service has been a customer of ours because we upgraded the entire radar network. Occasionally, we are on briefings side by side with them to cover aspects that are maybe more specific to an industry or government entity. For example, like a department of transportation, a state level department of transportation where we have the expertise and the impact of weather on the roadways and all the advanced modeling.
So and then, obviously, we, you know, we utilize a lot of the National Weather Service data and then, you know, make enhancements and things like that. So, yeah, it’s yeah. I wouldn’t it’s not something necessarily that’s a formal relationship, but we do work side by side in different instances depending on the application.
Okay.
I will wrap this up then. If we haven’t gotten your question, I certainly will get back to you. We’ll answer these offline. Thank you again for your time, everyone. Thanks for joining.
Have a great day.