Webinar: Seeing Through the Storm: The Impact of Real-Time Flood Monitoring on Water Management
In a recent webinar, experts discussed the integration of ICEYE’s satellite technology for real-time flood monitoring and emergency response. Utilizing synthetic aperture radar (SAR), the technology can analyze flood events and provide critical data on the extent and impact of flooding. The session highlighted the importance of data-driven decision-making in emergency management, including the deployment of resources and assessment of damage. Audience engagement through polling questions emphasized the challenges faced in flood risk management. Upcoming webinars were also announced, focusing on AI advancements and drone detection technologies.
Transcript
Welcome to our webinar today, entitled real time flood monitoring, transforming emergency response, and water management.
Before we get started, just a few housekeeping items.
This session is being recorded and will be shared with everyone after the event.
Everyone is on mute, muted by default just to minimize background noise.
Please submit any questions anytime via the q and a panel. We’ll address them live as time allows and follow-up directly with any we miss.
If you have technical issues, try refreshing your browser or just leaving and rejoining the session.
We’re gonna, ask a couple of poll questions during the event. We’d love your input on these questions. They really help.
The length of the presentation is about forty five minutes. And after the event, we’ll send recording poll question poll results, and a short survey to all registrants.
Today’s agenda will welcome today’s speakers. We’ll introduce our partner, eyesight, and we’ll talk about the overview and benefits of eyesight. We’ll see some real world use cases.
We’ll talk about the integration between ICEYE and WebEOC.
We’ll get a live demonstration.
We’ll field your questions.
We’ll talk about future webinars, and finally, we’ll end up with how to learn more.
Our speakers today, Mike Bennett is head of government solutions North America with ICEYE.
Libo Mashishi is a solutions engineer with ICEYE.
Matt Cronin is our own VP of solutions engineering here at Juvare.
And I’m Jeff Urkovich, director of partnerships at Jabari.
Let me go up let me go ahead and pull up that first poll question for you.
Question one. What’s your biggest challenge with flooding? What is your biggest challenge when it comes to anticipating, responding to, and recovering from floods? Please make a single choice. I’ll give about one minute for everyone to to, weigh in on this question, and we’ll move on after that.
K, everyone. The questions are the answers are coming in. Appreciate your feedback. About about thirty more seconds to go.
What is your biggest challenge when it comes to anticipating, responding to, and recovering from floods?
Excellent. Looks like we’re getting all of the, all the responses.
Hey, everyone.
Thank you, and we’ll move on to the presentation.
Turning things over to Mike Bennett. Mike, please take it away.
Thanks a lot, Jeff. Appreciate everyone’s time here on this, this early afternoon right through your your lunchtime.
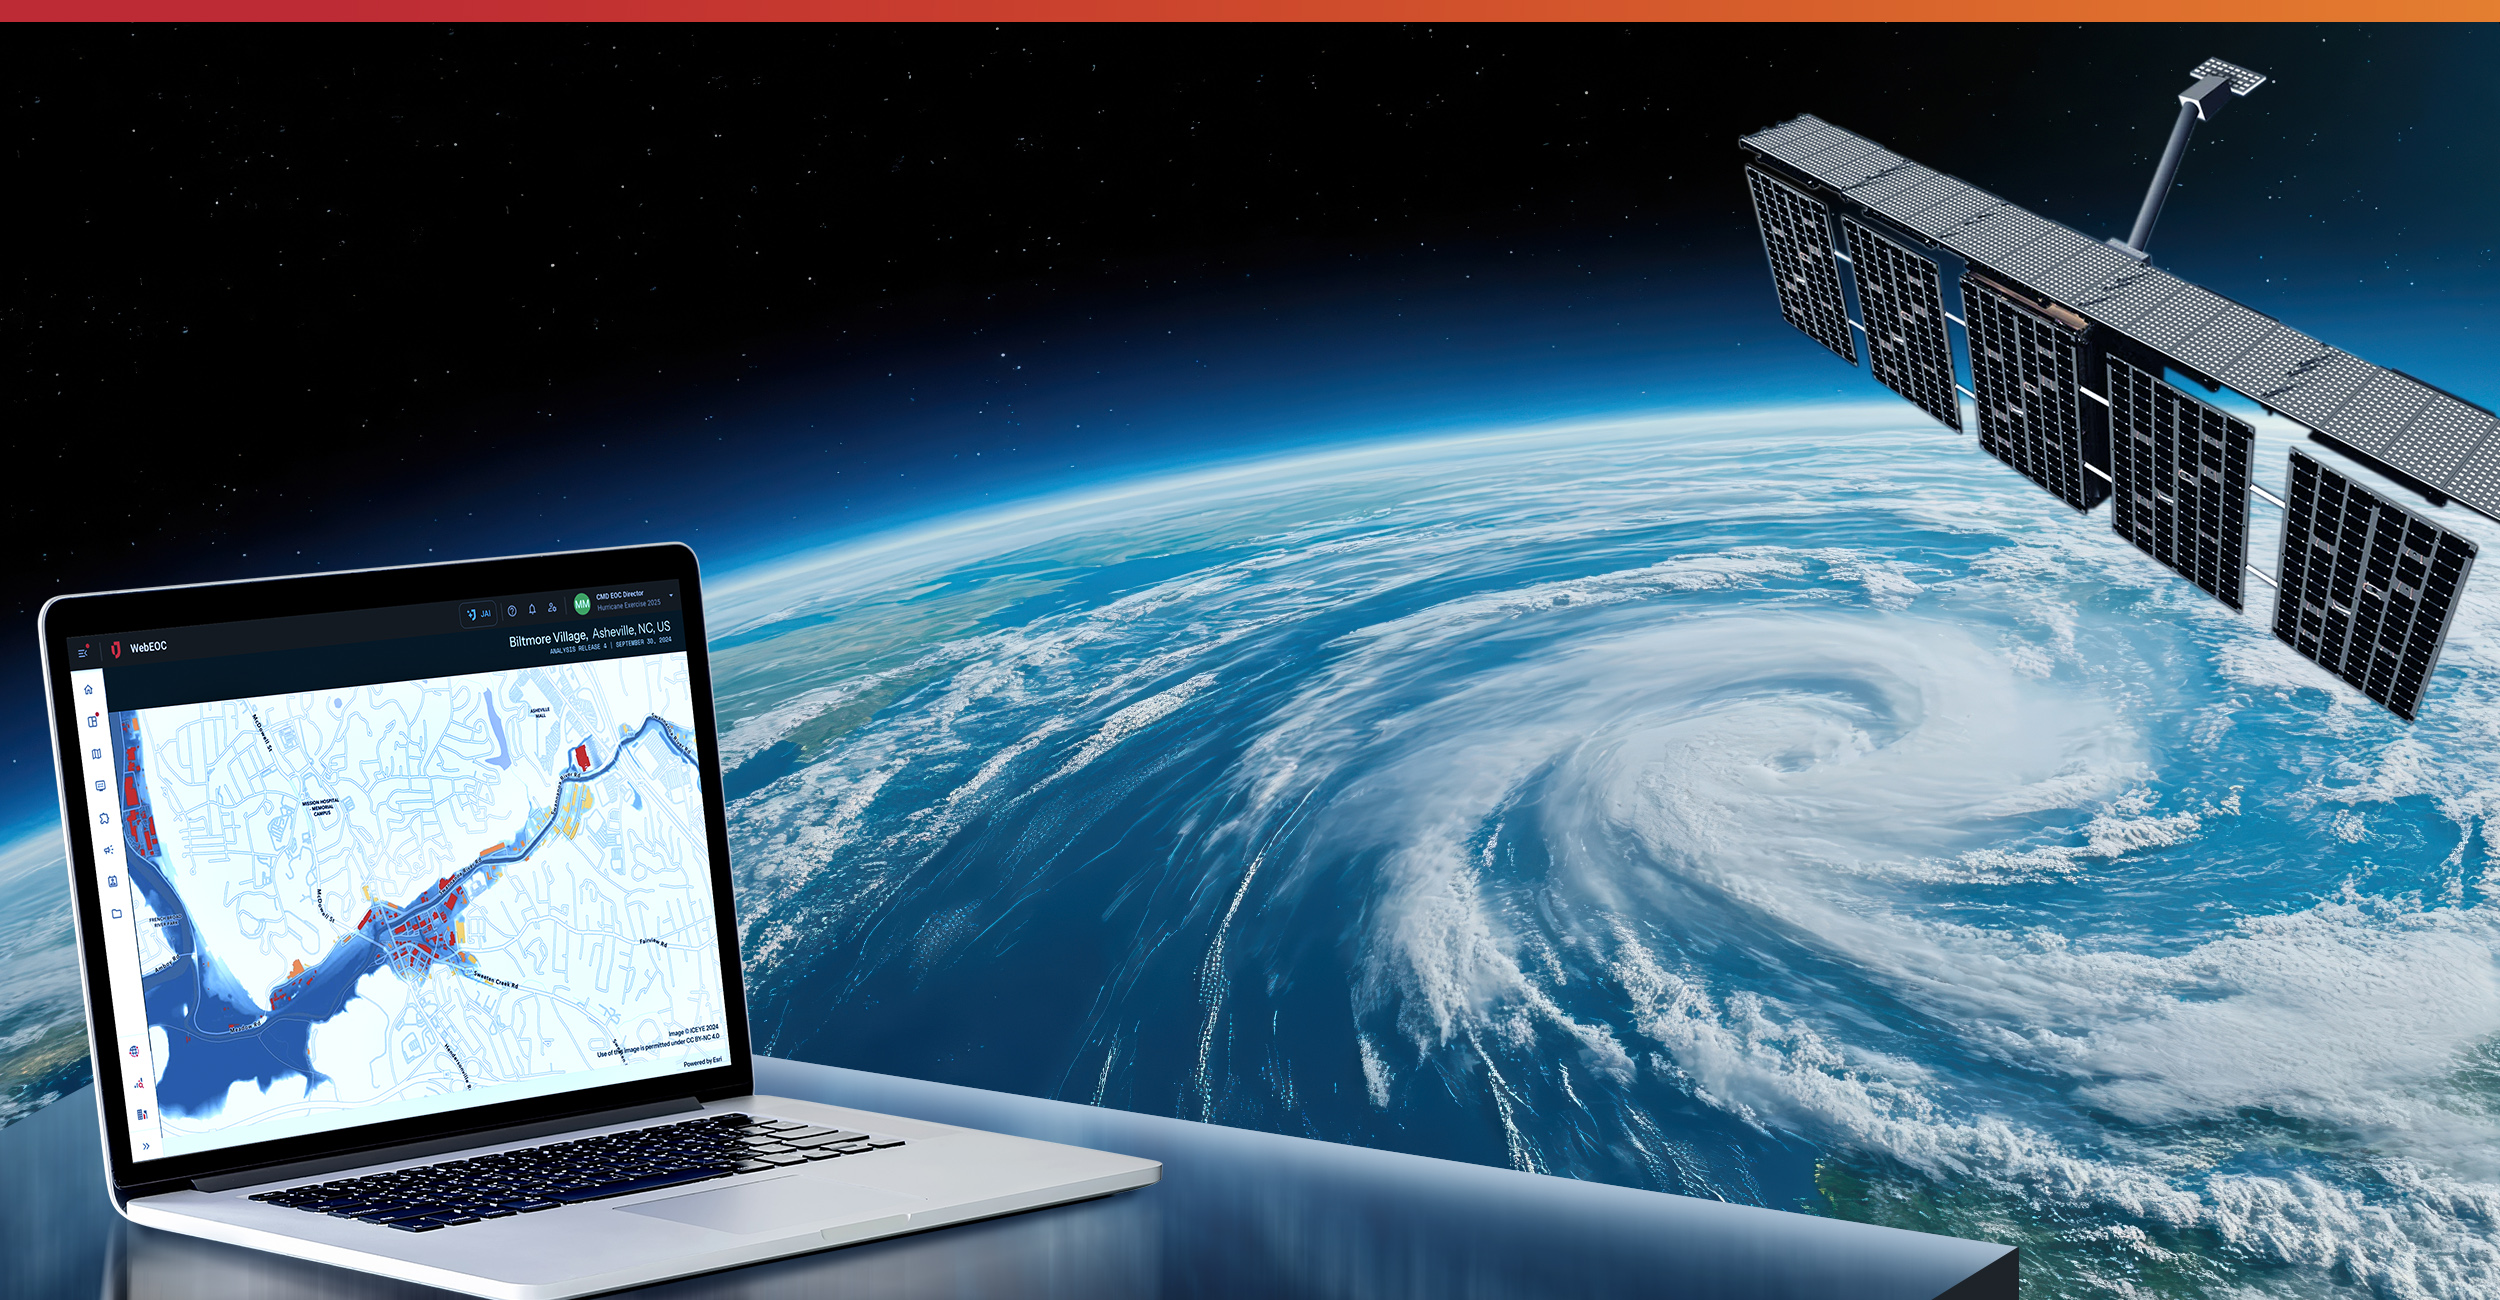
As Jeff said, we wanna talk a little bit today about ICEYE, what it is that we provide, and and walk you through a particular case study of the use of ICEYE data within, water management district in Florida. But I wanna start off with who ICEYE is.
What if you can see everywhere around the Earth at all times right through clouds and through smoke and through nighttime?
That’s what ICEYE is about is is understanding the pattern of life. So a little bit about the company itself, ICEYE, we’ll go on the next slide. ICEYE itself was founded about a decade ago. We launched our first satellite back in twenty eighteen.
The type of satellite is something called SAR, synthetic aperture radar satellite technology, which I’ll cover in just a second here and talk a little bit more about why that’s so unique and why it’s important for something like natural disaster monitoring.
We’ve got more than eight hundred people at eyesight. We’re growing pretty rapidly here. We’ve launched more than fifty satellites since that first satellite was launched in twenty eighteen, and we’re launching satellites at about twenty to thirty satellites per year clip. So So we’re continuing to improve the size of the constellation, which means that we’re getting closer to that goal of being able to see everywhere around the Earth all at the same time.
With our satellites, there’s a a huge component that is used for being able to image what’s happening on the ground, see certain, use cases that fit in the defense and intelligence community, but there’s also the natural disaster side to it. And with that, we’ve been able to analyze hundreds of of floods and hundreds of wildfires since we started down this goal back in twenty twenty one. Our US headquarters is in California. We’ve also got a global headquarters in Finland and offices throughout the world, whether it’s in Australia or Japan, parts of of LatAm or or other areas within Europe as well. Next slide.
Covering a little bit more about what is SAR. So SAR itself, it’s not a new technology, but what is new is the ability to create star images from a miniature satellite, a small stat, and then filled out these large satellite constellations that allow us to have extremely high revisit rates.
Star is precisely what it sounds like. It’s a radar satellite.
It’s imaging the earth and measuring their reflection back to the satellite based on its its, synthetic aperture.
And what it’s seeing is, on the ground, what exactly is is happening? So it could see through clouds. It could see through wind and rain, which means that we could image the earth even during stormiest conditions, during a hurricane or a severe thunderstorm.
It’s imaging at nighttime or daytime. It doesn’t need sunlight in order to be able to operate. And you can see through smoke and ash, which means that we can get at the heart of what’s happening beneath the smoke from a wildfire, allowing our data to, observe the conditions and lead emergency response operations.
Next slide.
Using that type of satellite imagery, we built out this whole team at ICEYE devoted to what we call solution.
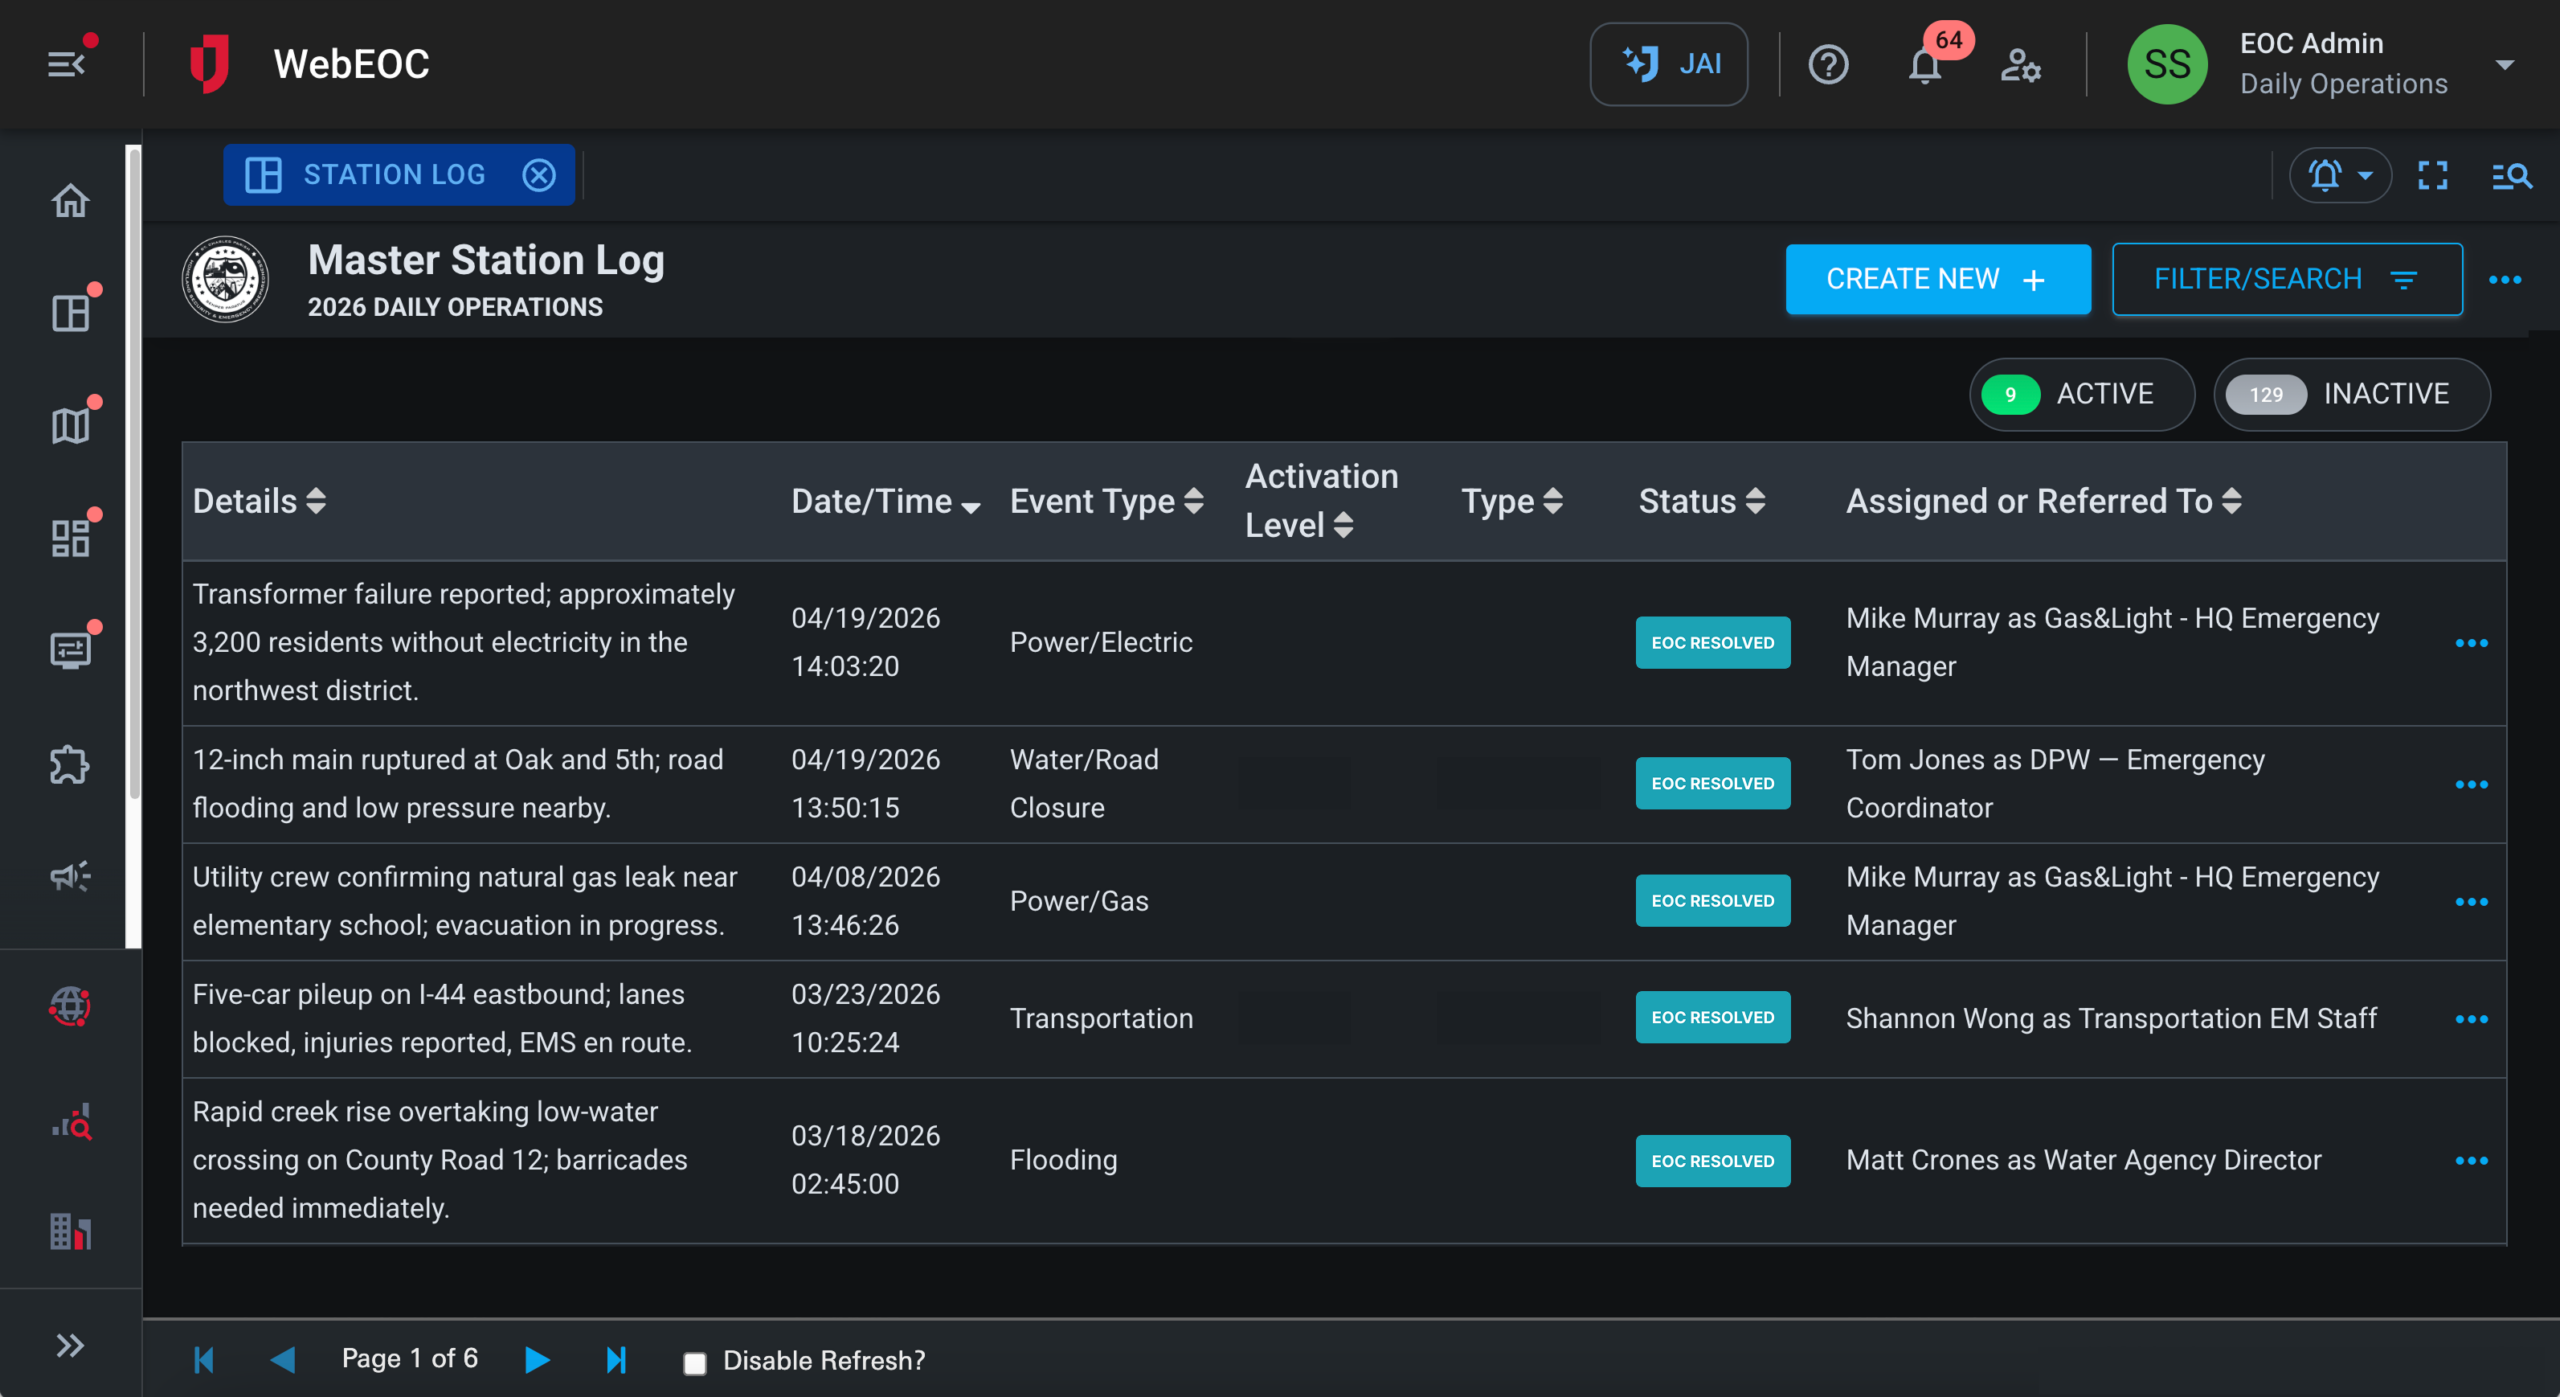
It’s mapping natural disasters in near real time. Specifically, as it relates to flood, which is gonna be the focus of what we’re talking about today, we analyze, in the US roughly thirty to forty events a year. In fact, this year so far, we’ve mapped more than thirty floods. We’ve seen impacts of more than two hundred thousand buildings and more than fifty thousand square miles of flooding. If you go back to twenty twenty one, we’re closing in on a hundred and twenty floods that we’ve analyzed, more than one point two five million buildings that were impacted. And if you could imagine, we haven’t seen any hurricanes yet this year, so I’d expect these numbers to continue to grow pretty rapidly.
In order to do what we do, we need to first monitor. We need to first understand what the conditions are that are present around the world to know where we have to task our satellites. And so what we’ve done is build out a team of meteorologists. My background is is meteorology, and so this was kind of my first task at ICEYE. I would understand how can we look for signs of potential flooding, how can we then observe the flooding, and how can we make sure that we collect data on that flooding. So our team of meteorologists that’s located around the world, they are constantly looking at, things like operational and ensemble forecast members, whether that’s numerical weather prediction models or even, some of the new AI systems. They’re looking at river gauges and tidal gauges, precipitation forecast, even looking at flood propensity maps.
Using that data, we are targeting in real time our satellites. So using that constellation of fifty plus satellites, we’ll look in an area and say, okay. How many images do we have in this area over the next twenty four hours? Let’s go ahead and collect all of them across this area. Devote the power of that full constellation to make sure that we are grabbing as much imagery as possible around some of these events. Once we go from monitoring, the next stage is into collecting the data. So we’re collecting data from our satellite.
Next slide. We’re collecting data outside of the satellite too. It’s it’s agnostic. The team is agnostic, I should say, to what type of data is coming in.
It could be a star satellite image. It could be a open source optical satellite image. It could be aerial imagery that’s coming in. It could be ground based imagery.
The example here is during a particular flood, a local news station may send a reporter out, and they may do a stand up in front of a store, and that store may have water up to the door handle. We’ve got a separate team whose entire role and responsibility at ICEYE is to be able to source that information, geolocate, and identify flood depth associated with that. That data along with the satellite imagery along with other datasets then goes into the final step of the process, the analysis.
And the analysis team is bringing in all these different data sources and collating them into a central database. Next slide. So that includes the satellite imagery. It includes the satellite images from ICEYE itself. It includes other satellite images if and where available. It includes open source images where we have those geolocated.
And we’re not talking about just a couple of open source images. In most floods, we’re talking about hundreds or thousands of open source images that are observations, actual observations of flooding. It includes digital elevation models that are, in in different areas where we are running an analysis and river and tidal gauges. All this being powered through, some elements of AI and a manually curated, ability to analyze the flood extent and the flood depth.
Once we have analyzed this data in near real time, once we’ve brought all that information in, this is where we start to push that data out and where all of our use cases within the community, the emergency management community, water management community, utilities, insurance companies, finance sector. This is where they start to utilize the information.
So from the delivery itself, and and I’ll let Lebo touch on this a little bit more later on, as well as Matt on the WebEOC side. But what we’re delivering is simply geospatial data. We’re not delivering imagery. We are delivering information on where the flooding is, how bad did the flooding get, and which buildings or critical infrastructure units may have been impacted by that, by that flood. So in this particular clay case, it’s a vector file and a raster file and some associated, geospatial or tabular release notes on those those floods.
The timeline in which we’re actually delivering this. So I talked about the meteorology team at ICEYE First. They’re building out flood monitoring applications here.
We are looking at where do we expect to see flooding, where are we observing flooding, and where are we running analysis in flooding. And all that information we push out to our clients, we’re making sure that we’re staying in constant communication with the community on this is what we’re seeing, and this is where we’re acting, and this is where you can expect to see something around, say, flood analysis, whether it’s flood insights or or any of our other products.
As the flood has started, we have an initial plot product called flood rapid impact, which I’ll I’ll touch on here in just a second. And as the flooding starts to peak, as we see the impact of that flood, start to affect population, that’s when we initiate for a full flood insight analysis.
That observed flood report is sent out initially as, within a couple of hours of the flood.
Look at where are we seeing an impact, who is being impacted the most, where are we gonna be analyzing in our first release, and then we deliver a first full release of flood insights within twenty four hours of that that flooding impacting population. That is that flood extent factor in the flood depth raster file, and we continue to update that as a cumulative look at the maximum flood extent and flood depth in real time. So every twenty four hours after that, we continue to send out new updates.
In some cases with very significant floods, we may send out an update, every twenty four hours for a week or two weeks or more, but we also analyze smaller flash floods. Some of the flash floods that we’ve seen, over the last couple of months, including in Texas, including in New Mexico and in Milwaukee, those are floods where maybe we’ve got three or four or five releases of data.
Next slide.
I wanna touch on flood rapid impact because that was touched on in that slide there as a more immediate impact tool of what it is that we’re providing. So flood insights is a manually curated, AI driven observational tool observing through multi sources, multiple sources, whether it’s ground based, air based, or satellite based where the flooding is. Flood rapid impact is much more of a AI driven automated tool based on our SAR imagery to give immediate situation awareness into a flood within six to twelve hours of the flooding starting, and and then continuing to update every six to twelve hours after that.
Where is the flooding right now? What is the flood extent? And where is it impacting the communities that we care about and that that you all care about? Where is it impacting the infrastructure, the roadways, the buildings, etcetera?
It shows the evolution, more simply, of the flood and where resources need to go now as flood insights then comes in to tell us how bad is it and where do we need to send resources to ultimately proceed to a more successful recovery.
From the use case side of things, it’s really the entire spectrum of emergency management, the full life cycle from response to recovery to mitigation to resilience and preparedness.
In the initial response stages, whether it’s flood rapid impact or flood insights, it’s helping to identify, at risk communities, lower middle income communities, and buildings that may be impacted, what the, business continuity, impact would be to a community, to critical lifelines in that area, ultimately helping to optimize rescues and evacuations in those communities and address threats to the critical lifeline and to the infrastructure, whether it’s on the utility side or hospitals or evacuation routes and roadways.
In the recovery stage, understanding how deep the water got at different buildings helps to expedite expedite damage assessments.
We’ve seen expedite damage assessments where our data was utilized at the local and state level as well as federal level. It helps to prioritize the cleanup efforts and ultimately the repair efforts in those communities and allows a more targeted rapid delivery of assistance and relief.
Moving into mitigation, which are some of the use cases that Lebo will talk about here with how South Florida Water Management District was able to utilize the data, it helps to prioritize which mitigation initiatives are actually going to make a difference in those areas and which ones need work.
Flood risk maps and flood models can be validated and calibrated using this data as it is an observational dataset, and it helps to update ultimately building permits and and different zoning restrictions in those communities.
And finally, from a resiliency and preparedness standpoint, it can refine disaster response plans.
It can optimize in the community and in the emergency management, directorate, different training and education material, inform investments and budget, and drive, ultimately, disaster resilience and financial resilience in that community to an ever increasing severity of floods and of disasters.
So I’d like to introduce on our end, Lebo Mashishi, who’s gonna walk through a little bit more of a technical look at how our data can be moved around in a GIS environment and intersected with some of the the infrastructure and critical lifelines that I discussed here. And then also walk through a real world case study with how the South Florida Water Management District was able to utilize the data on several events in the past to drive towards resilience and, ultimately, optimize mitigation efforts in their special districts and communities. Lebo.
Sure. Thank you, Mike.
So, essentially, Mike spoke about, flood insights, our comprehensive product that gives you access to maximum flood extent as well as a maximum flood depth. And I want to take you through, the different layers that you will receive with this particular product.
The first thing that you receive is a file called flood extent. This is delivered as a vector file format in either geo package as well as a geojson.
Our data is very interoperable, so you can pull it into many different GIS systems and online platforms.
Flood extent essentially shows you the extent or the maximum extent of the flooding. So with this view, you are actually able to see where the flooding has been observed in certain areas.
It’s also quite granular, so I can zoom in to different levels. So I can actually start doing some form of visual analysis in terms of the damage that the flooding might have caused in different areas.
And at this point in time, the answers that you are, are looking for or trying to answer is where is the flooding or where is the flooding not happening at that particular moment.
The second datasets that you receive with flood insights is something called the flood depth. And in this instance, it actually helps you to understand not just where the flooding is, but the severity as well as the impact of the actual flooding itself.
So the flood depth is an actual pixel level depth analysis, that shows you observed flooding depth. So if I zoom into specific areas, you’ll notice that I’ve got darker shades of blue as well as lighter shades of blue.
Darker shades of blue essentially showing me, the deeper areas where I potentially have high flood depth, And the lighter shades of blue are areas where the flooding is a little bit more shallow, so lower, depth values.
I zoom in once again quite granular. I can actually start to analyze or look at the impacts that this mice might have had, in terms of the infrastructure or as well as the buildings in that particular area itself.
The third layer that we have with flood insights is the building statistics layer. And this is essentially a FEMA building, footprint data set that we used to create these building statistics.
We superimposed the flood depth data onto the building structures to help you actually understand the impact on the flooding at a more granular level like buildings. So if I have a look at the image right now, not only do I see where the flooding has actually happened, but I’m also able to see, essentially what impact it has had on an individual building.
Looking at the colors on the map, darker shades of red, essentially showing me buildings that have been highly impacted by flooding as opposed to the lighter shades where the flooding, like I mentioned, is much more shallower at that particular point in time.
As I mentioned, our datasets are interoperable. You will receive it in a geopackage, a geojson, and you can plug it and play it into any GIS system.
But you can also start to do some of your own analysis as well as your intelligence using this particular data set itself.
With this particular, flood event, what I wanted to have a look at was also the impact of the flooding on the roads. So which roads were completely inaccessible or maybe completely destroyed and which roads were a bit more safer to drive in?
I then extracted the flood depth values onto an OSM roads dataset in order for me to be able to see this feed. And as I zoom in, maybe switch off that layer, I can actually start to see the roads that were heavily impacted by the flooding, which are indicated in that red as well as that orange color, as well as the roads that are potentially safe for me to drive in and not that impacted by flooding.
And roads is just one dataset.
You can use many different datasets depending on what your scenario is.
When a flood is happening, health services is very important.
So what I wanted to have a look at impacted health services, things like hospitals as well as clinics.
I then went and I extracted these health services datasets once again from OSM, and I was able to actually map out all the different clinics as well as hospitals in the area. But then I wanted to kind of zoom in a little bit more and identify health services that were impacted by flood. And then I’m able to do quick GIS analysis, and then it tells me which ones have been impacted by the flood itself.
Now as I switch on to a use case by one of our customers, South Water Florida, management district, you can start to imagine a wide events, events like hurricane Ian.
For South Water Florida management districts, the challenge wasn’t just knowing flooding had occurred, but it was actually just identifying how much water is entering the system. So, essentially, just quantifying how much water, was entering the system itself. And flood in sites through the flood depth was able to provide that value that volume.
This is very valuable because releasing too much water downstream communities while holding too much can be very dangerous.
So with flood insights, they could strike the right balance. Now when I overlay this particular data, hurricane Ian, with additional infrastructure layers. So here, I’ve got electrical poles.
I can start to actually extract some of that intelligence from the flood data onto my data. If poles are submerged in water, we risk widespread power outages and safety hazards from downed lines.
So if I zoom in, you’ll notice that I’ve got my electrical poles and once again just extracting that intelligence from the flood depth onto the poles in order for me to start making decisions during a flooding itself.
I also have a dataset, which is substations.
And if substations are submerged or flooded, entire neighborhoods and critical facilities like hospitals could lose power for days or even weeks. So really identifying those, substations that lie within the actual flood flooded area.
We can also start to bring in things like parcels so we can essentially immediately identify which homes and businesses within the actual community, are sitting within the actual flooded zone.
Now if I zoom to a coastal area, we can see how flood insights can help in a storm surge situation or storm surge flooding.
So with southwest, with South Florida waste management districts, they purchased, the hurricane Helene as well as the hurricane Milton, datasets.
But here, the driver was really resilience as well as partner support.
So for Helene, the data helped resiliency partners understand the surge impacts as well as prioritize a response. But for Milton, the data supported Cape Coral’s mutual aid request, giving them visibility into inundation areas.
So it also guided high watermark collection teams ensuring that they were deployed to the right spots for FEMA documentation as well as mitigation planning.
So we just had a look at bigger events.
Zooming in into a much more smaller event, but equally as important that happened in April in twenty twenty three.
Here, flood insights was used to validate inundation levels alongside South Florida West management district’s internal models.
So essentially combining the two, water managers were able to actually deploy teams onto the field a little bit more efficiently. So no wasted trips, no and faster response to the hardest hit communities. Because with this data, we know where flooding has been observed so we can prioritize evacuation plans as well as some of our work efficiently, saving cost, and increasing public safety.
We’re gonna hand over to you, Jeff. That’s it from my side.
Hey, Libo. Just trying to get my video back here.
Thank you. That was great, Libo. Much appreciated.
Let’s pause for one more, in our last, poll question right now.
Okay. Your current approach to flooding. How would you describe your current approach to flood risk and disaster response?
This is another single choice answer. I’ll give you, about a minute to go ahead and and, give us your feedback on this question.
Great. The question is how would you describe your current approach to flood risk and disaster response?
And about another twenty seconds or so, to get this one answered. I see some answers coming in. Really appreciate the input here.
Great. It looks like we’ve gotten a lot of responses.
Thank you again for your input, and let’s close out that poll and move on to the next part of our presentation.
Great. I’d like to introduce, Matt Cronin once again to stop to speak about our ICEYE and WebEOC integration. Matt, turning over to you.
Thanks, Jeff. Can you, proceed next slide?
Yeah. So this provides really a single plain of glass in WebEOC, really streamlining, you know, multiple systems into one. So bringing that intelligence and data sharing of these layers into WebEOC.
Let’s let’s go ahead and take a look. I’m gonna go ahead and share my screen, take a look at what this looks like, in WebEOC so you can see what this data looks like. So, Lebo had did a great job of showing the the power of this data in ArcGIS or other, GIS platforms.
But then those layers can be brought into WebEOC. They can be overlaid into, you know, with other datasets in WebEOC. They can be accessible right from your, home page here in the Nexus environment.
This might look a little bit different. If you’ve seen WebEOC, this is our latest and greatest, version of WebEOC.
We can jump jump right to specific maps that are permission out to users as appropriate, and then those users can drill in and get those quick insights to that data that’s coming from, the ICEYE data. So in this case, you can see some of the data, that was coming over like, like we just showed that shows the the flood depth, for Milton as well as the impacts to specific buildings. You can kinda drill in. You can, click on these locations and see the particular depths for various locations. As I as I click around, you can see those different depths. Right now, this is showing it as inches, but you could change the, you know, that to feet inches.
You can make those adjustments on the GIS side of of how you want this data to be presented. But even without those adjustments, it’s it’s really powerful, information. In WebEOC, you have your other GIS tools such as being able to look at, change your base layers. So I might wanna look at the, you know, the imagery information. I can go in and I can change, things like the, opacity of that data. So I can see, through that. I can turn on and off different, layers as necessary.
I can, print the map. So I can go in here and say, you know, Milton impacts include the legend, and, this will give me a nice, copy of that, that I can print out. So, you know, a lot of your, you know, existing WebEOC capabilities can be brought to bear with this very, powerful, dataset coming from coming from iSci. So this is just Milton.
Just some other examples to look at. This is the Helene, up in North Carolina that got devastated, up in up in this area. You can see all the, devastating, building impacts here. I can look at the the flood depths, at at these different locations here again just by clicking those locations.
Again, all those options to use my different GIS tools at WebEOC, that would be available. Maybe I wanna look at the, distance, you know, from one side to the other and, look at that through different measurements, maybe in feet, or in, miles. I can use those tools or, again, to go ahead and, print a nice map for that. One other example somewhat unrelated, but just wanted to touch on it is that ICI also does, wildfire, which isn’t the theme today.
But you can see there’s very powerful data here in terms of assessments, from a wildfire in California. And, again, we can change the layers, and you can kinda see the the buildings that have been, devastated versus those that survived that that event. So, really powerful data for, for both flooding and wildfire and the ability to bring this data into WebEOC, through our, Esri based, GIS, integration, provides some really great insights, to this information.
So, let me stop there and, turn it back to you, Jeff.
Thanks, Matt. Much appreciated.
Let me get my share back here, my video back. Great. Fantastic. So we have a few questions. I’m gonna go ahead and put them out to the group, or maybe I’ll pick a couple of individuals on our on our side to to answer them.
Sounds like the first one is for for Libo.
Libo, how quickly can ICEYE provide data after an event?
Yes. Sure. So ICEYE can deliver, our flood asset maps within hours of a major event.
So even in areas with cloud cover or at night, thanks to the consolidation, and, essentially, the speed gives agencies a head start on response and and recovery.
Flood rapid impact is delivered within a few hours of the start of the flood, so between six to twelve hours of the actual flood itself, while flood insights, which is the more comprehensive product, is delivered within twenty four hours, of the actual flood itself.
Fantastic. Thank you, Lebo.
Next question. How how does the integration process what does it look like? How challenging is it to to integrate the products? And I’ll give that to Mike and or Matt, maybe, one with the other backing up.
Matt, do you wanna do you wanna start on this one? Then I could I could back up.
Yeah. So, I mean, ICEYE provides us data in a in a GIS format, that can be easily brought into WebEOC. So in WebEOC, you have we have a, you know, GIS side or mapping side, where you can create any number of maps. And you can, within those maps, you can create any number of, both data that lives in WebEOC and, map layers, whether they be local layers or third party layers.
In this case, obviously, we’re talking about third party layers. So, ICEYE provides that data in a, in a in a format that we can consume that we can then, whether it be well, they have a number of ways they can provide it, but several of those formats, we support. And so we can bring those layers in, and and, again, they can be easily added just within a matter of seconds. And then they’re continually, you know and and, Mike could talk to this, providing, you know, more and more updates over time, and those are very easily, you know, updated in WebEOC as that data is updated.
But, Mike, you might wanna speak to to that process a little bit.
Yeah. I think just just in in general, and if it wasn’t already clear on on what Matt and and Leba walked through, you know, what we’re providing are are geospatial datasets. It’s it’s not imagery as it relates to natural disasters. It’s it’s more the answer. Where did the flood go? How deep do the floodwaters get? Which buildings were damaged in an earthquake or or in a fire?
Where was the damage located after a hurricane? And so these are geospatial files that that easily integrate into any ArcGIS environment and easily integrate into WebEOC and, certainly, in WebEOC, allow for more shared collaboration, from from field teams to the EOC where everyone’s operating on that same common operating picture.
Excellent. Thanks, you guys.
Let me see. I have another question here.
How does the integration improve collaboration during a crisis? And I think that’s probably best answered by Matt.
Yeah. So it gives you, really operational visibility into, where these impacts are. And then, I didn’t as much show it. Spoke to it a little bit, but, you know, folks already have datasets of where their critical facilities are, where their hospitals you know, that includes hospitals, shelters, other locations that are critical for, you know, operations or for the corporate side, your, you know, your your facilities, your your businesses and locations. So you’re able to overlay, those layers and, see the impacts, to those locations, with this information.
And it’s, you know, obviously faster than, you know, you know, the other methods of of gathering this information. So the speed in which you could get, this data to drive decision makings, that decision making, I think, is, you know, the key, with it.
Thanks, Matt. Another one for Lebo. What is the delivery method for the flood data? I think you touched on this a little bit, Livo, earlier, but if you would just hit that question again.
Yeah. Hundred percent. So as I mentioned, our our files are delivered using different file formats, and, essentially, that’s just to allow for interoperability. So we’ve got a Geo-JSON for vector files, a dot GeoTIFF for, imagery files, as well as a GeoPackage.
So these are delivered in the formats that will align with your your systems and your workflows as a as a company or as an organization.
Essentially, customers can take it and upload it into, WebEOC, as well as many other geospatial platforms. I was using not just Pro. It can be used, in QGIS as well as many other GIS systems as well. So you can access it directly in WebEOC, but also get a hold of those files and use it in many other GIS platforms as well.
Fantastic. Thank you, Lebo. Question for Mike. How accurate and reliable is ICEYE flood data compared to traditional sources?
Yeah. It’s a great question. So, if you look at what ICEYE is providing, it’s a observation based tool here. And and so sometimes it can be challenging to to validate something observational like flooding from our satellites because there doesn’t really exist, any other spatially, and and temporally filled datasets around flooding. So what we do is we aim to look at where we have them available, high watermarks.
With something like wildfire, we aim to validate it with, building damage data set, like, in California, the DIN data. So with wildfire specifically, with the LA fires, we saw precision rates of ninety nine percent, meaning that, we accurately identified the damaged buildings with ninety nine percent accuracy.
Overall balance accuracy, ninety five to ninety seven percent. With flood, again, it’s it’s hard to measure exactly, but what we see is, as an example in hurricane Ian where we had a a plethora of high water marks from, USGS, based on on breaking out into different sub-clusters by ICEYE, we saw, recall rates of ninety to a hundred percent, meaning of those high water marks we captured ninety to a hundred percent of them, and mean absolute errors, that that range generally from twenty five centimeters to, say, fifty or sixty centimeters in some of the the inland lake driven, type flooding areas.
Great. Thank you, Mike. One one more question. Flood coverage is only US, or is it around the globe?
Yeah. I could take that. So we’re a global operation.
Our satellites aren’t geostationary. They’re not locked in on the US. They’re constantly orbiting, most of them polar orbiting satellites, a couple mid inclination orbits.
So we are monitoring for flooding globally. We are very strategic in in how we onboard new countries, how we bring that that country into our our forecasting, how we bring it into from other auxiliary data sources standpoint, making sure that we are are focused on areas where our customers have interest, and areas of of high propensity to have disasters like flooding.
So for Flood Insights, I believe we are somewhere between thirty to thirty to forty countries that we have onboarded.
We’ve got clients everywhere from, Europe to parts of Africa to LatAm, and then, some of our biggest clients in in APAC, like in Australia and Japan.
Fantastic. And we have one last question. Is ICI flood data reimbursable under federal disaster programs? Mike, I think that’s probably best answered by you also.
Yeah. So I could stay on camera for this one too.
It’s a good question, and and I have to be careful at at at what I say. Right? Because I I can’t guarantee anything.
But we’ve seen often that, data like ICEYE flood insight is is often reimbursable.
The key is really documenting in a disaster, especially declared disaster, that how the data is used, how it helps to inform the response and recovery mission in that area, and just making sure that that in the use of the data you’re coordinating with, whether it’s state or federal officials, and and, again, the key is documenting everything.
Fantastic. Thank you, Mike. Okay. With that, let’s move on to the next section. We have some great webinars coming up that I wanted to, reach out to all of you and and welcome you to join.
On October seventh at one PM eastern, we have a webinar called transforming WebEOC workflows with Juvare AI or or it’s actually called Jay for short. It’s Juvare AI assistant. Does some amazing stuff.
The world of AI is changing so fast, and, this is you’d be very impressed with this new tool from Juvare. So please join us on October seventh at one PM for that. On October twenty third, we’re going to do another webinar with a partner. This is with our partner FleetUp who does fleet tracking and just has some amazing insights, into your fleet management.
Later in the year, drone detection, we’ll be doing, with a company called, AirSight. That is our new drone detection partner. So lots of good stuff coming up.
With that, I will say thank you. Oh, well, sorry. How to learn more. If you need to learn more, you’d like to learn more, you can reach out to me directly. I’m Jeff Urkovich, and there is my email address.
You’ve heard Mike Bennett on this call. Mike is also open to any email questions you may have, so, please feel free to reach out to Mike. You can request a demo through our Juvare website. There’s a demo page there. Just fill out a couple of, a couple of fields, and we’ll get back to you and talk about our demo.
You can visit ICEYE, at ICEYE.com slash solution slash government, or you can see all of our partners at Juvare.com/partners.
And with that, I will thank you for your time, if I can get that, and, remind you that we are going to be sending out a survey. We’d love your feedback. Anything from, how the how the presentation was for you to what you learned, we’d love to hear more. Thank you, and have a great day.