
In this webinar, representatives from Juvare and LUMA Energy discuss strategies for optimizing utility damage assessment during storm recovery operations. LUMA Energy panelists share their experiences managing post-hurricane restoration in Puerto Rico, specifically detailing the transition from using general-purpose tools like Excel to implementing Crisis Track to meet stringent FEMA reimbursement and audit requirements. The session includes a detailed product demonstration of Crisis Track, showcasing its web console and mobile application capabilities for real-time data capture, offline functionality, asset tracking, and automated reporting. The presenters emphasize the importance of a holistic approach involving people, processes, and technology to ensure accurate, validated data that accelerates restoration and supports federal funding claims.
TRANSCRIPT
Welcome to our Crisis Track webinar entitled modernizing utility damage assessment for faster defensible storm recovery. So for today, I’m your host. I’m the promotions director here at Juvare. My name is Jeff Urkevich.
Chloe Jones is our senior solutions engineer. She’ll be giving us a demo video a little later. And Ron Juarez is our executive for energy. And that’s what I’d like to turn things over to.
Thank you so much, Jeff. I’ve been working here at Juvare coming up on my fifth year in twenty twenty seven. So very exciting organization to work for, and, I’ve had the pleasure of working with our utility community. And it’s been an exciting journey learning all about what you do to keep our community safe.
I enjoy working with several of our clients, one of whom is our guest panelist for today’s webinar. Luma Energy, the company responsible for operating and maintaining Puerto Rico’s electric transmission distribution system, Burluma brings valuable frontline experience in strengthening storm response, coordination, damage assessment, restoration, and accountable recovery documentation for these types of storms and hurricanes and events that we’ve all come to know over these last few decades. And so with that in mind, wanna also talk to our guest today, and our presenters. We have Achal Fraley, who is the chief of corporate services officer.
We have Riverto Gonzales, who is the director of construction, and Mariel Cruz, who is the director of asset management. I wanna thank you all for taking the time to join us today. With that said, want to get started with our first question that we have here, which is what problem were you trying to solve after your prior storm experiences?
So good morning, everybody. Michelle Fraley here from LUMA. Give a little bit of background. So LUMA took over from the PREPA monopoly on one June of twenty twenty one.
And our first, I’m gonna call it real storm, was Fiona, which occurred in eighteen September of twenty twenty two. And so after experience of Fiona, the problem that we were trying to solve was how to get damage assessments quickly and accurately. In our case, all our assets belong to the government. So in our case, the reason behind that is to be able to submit to the Puerto Rico initial damage assessment grant portal in the hopes to get a presidential major disaster declaration or an emergency declaration so that our damages and the expenses, related to the damages could be refunded by the federal government.
And so for many of you who have worked with FEMA, as you know, it is extremely important to have accurate damage assessments and quickly because, again, as you know, in an emergency, you are trying to safely and quickly restore. So your damage assessors have to move as quickly as your restoration crews to be able to meet all the intent here of safely restoring at the same time of getting the accurate damage assessments.
That’s great, Michelle. I guess you learned quite a bit from your past experiences and some of the different storms that you had had to face specifically there, Fiona, in twenty twenty two. For my next question here, what I wanted to ask was what made general purpose tools risky for reimbursement compliance or audit readiness based on, what you saw, during those responses?
Yes. As a new company here in Puerto Rico, most folks rely on working on Excel spreadsheets. During Fiona, we also tried other tools, applications that already exist. And the issue or the challenge that we have is that, you know, FEMA looks for very specific fields when you are doing damage assessments on utility type resources.
So, again, a general purpose tool didn’t really have the functionality nor the data elements that we needed to be able to submit to the Puerto Rico initial damage assessment. So in that quest, we tried different things. We had already made a decision to use WebEOC for our emergency management tool until we were trying to look for something that could feed into WebEOC. And in the different trials, that’s how we decided to choose Crisis Track as our tool, understanding that Crisis Track has the data elements required to be able to fulfill the initial damage assessment grants portal requirement for FEMA.
So again, even though a general purpose tool seemed like it was the easy way to go, it really doesn’t serve the purposes for the FEMA requirements on the specificity that you need. Then the other piece is, as you all know, in the utility business, you know, there there’s different ways of doing damage assessments, whether you’re doing transmission, distribution, substation, underground, telecom. Telecom. And so we were also looking at a tool that we could tailor for those five different subsets and comply with the details that FEMA required.
Thank you so much for that, Michelle. That gives great insight as to what day to day or I should say storm operations look like when the storm hits the ground and there is a focus to serve the community. I guess with that in mind, Jeff, can you tell us what the results of that first poll were?
Yeah. Absolutely. Ron, the question was, what is your role in storm response and recovery? About forty percent said utility operations slash EOC, twenty percent were compliance documentation, and the other forty percent was technology slash other.
Yeah. That’s right. And and this is a poll that we’re working through now. I guess the question that I have for the audience here relating to what we just heard from Michelle is how do you currently capture your damage assessment information? I hear responses to this question quite often when I’m at conferences or speaking to our different utility community members throughout demos. But there seems to be several different approaches that are based on disparate systems.
Systems where you’re kind of working with one tool in one area and then, you know, you’re working with perhaps a paper tool in another. And so really, you know, what we want to try and and get an idea of is how you’re currently doing this, what that process looks like for you today. Because as Michelle has mentioned here, it comes with its own challenges and, you know, that’s what we’re looking to remedy with Crisis With that said, I’ll be going to the next question here. What new capabilities is LUMA implementing with Crisis Track to strengthen hurricane response and restoration?
Yes. Hi. Maria Cruz in here. Well, in Puerto Rico, we live in the path of hurricane.
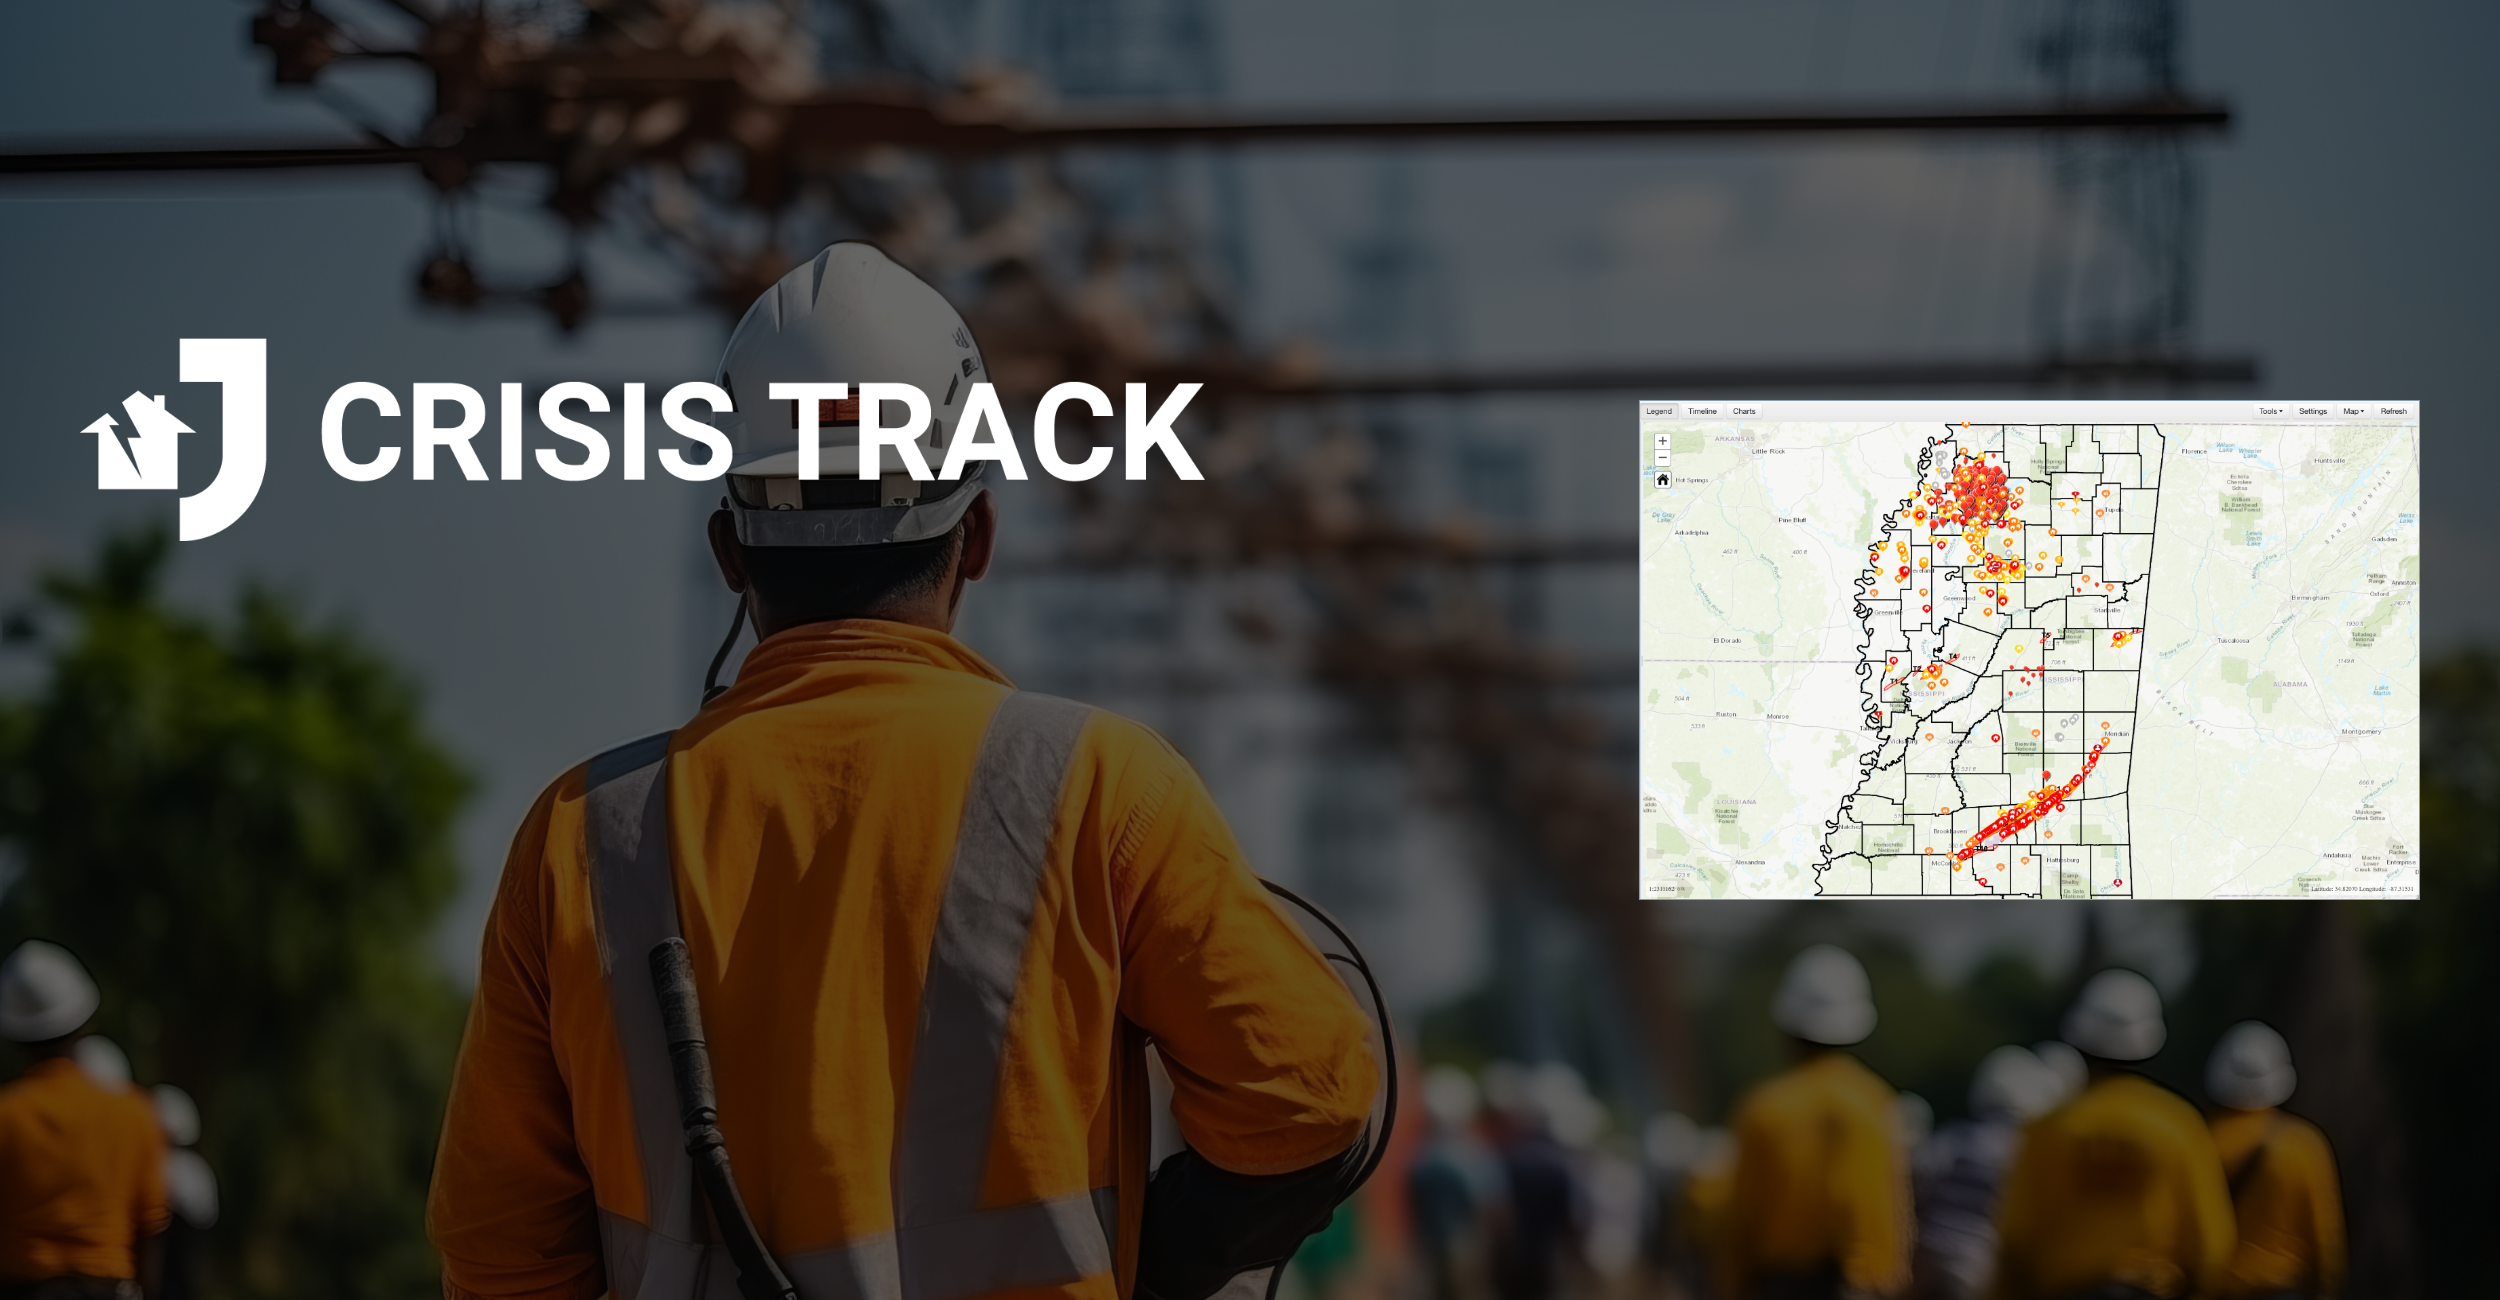
After a storm, safe and rapid restoration depends on how quickly we can identify, document, and validate damage across our network. That’s why we are configuring a new solution in Crisis Start with Juvare, combining a web console and a mobile app so field crews can capture and send information in real time. So this is an overview of the tool that we are configuring right now. I’m not expecting to go, like, one by one as it wasn’t raining, but I’m going to show you as the crisis track environment and capabilities that we are getting and configuring with the team.
We are going to work based on jurisdiction that in the case of Puerto Rico is gonna be municipalities. And, also, we will have the capability to identify the specific incident that we are working. A key capability that we consider is assigning each inspector team to a specific feeder or transmission line. So in this one, as we are showing there, we can add a specific crew inspection or damage assessment crew to a specific team and a specific circuit.
Their tablets and this is switching to the Crisis Track mobile application. Their tablets automatically receive a prioritized list of poles, transformers, and other asset to this. As we can see, we have the feeder assigned, and we receive all the information and the asset that they need to visit. That creates an efficient, repeatable process.
Inspector document damage, engineering validated material, and operation plans restoration. Crisis track map based forms make data entry fast and consistent. As we can see here, for each asset, inspector record the GPS location, select standardized damage types, and attach photos with timestamp.
The app supports asset specific fields, for example, port class and high, hardware type, conductor specification, or transformer KVI capacity so engineering can calculate exactly what’s needed to restore service safe. The mobile app lets inspector work offline, continuing to collect data even when networks are down, the communication network. As soon as connectivity return, the device securely uploads all the photos and observation and location preserving the integrity and sequence of each record. Back in the console, if we switch in here, we see the damage captured in the field as it comes in.
When we go to the same damage assessment or area that we were assessing, we can see there that coloring and some symbology. We can see the damage on the information captured by the film inspector. So engineering or will be validating material and quantities, flag any special safety requirement, and prepare restoration work packages. As you can see, we will see all the damage information as collected in the field, including the photos.
So you will have all the information at almost real time. As we can see, you have there the same photographic that was captured in the mobile application. From the same console, we can generate automated reports that summarize assets, damage categories, location, and supporting photos. This report will be are ready to download and share as supporting documentation for internal planning and external stakeholders.
So that is something that is comes automatically with the same information and all the data needed for documentation. This extracted documentation also supports FEMA reimbursement in our case by standardizing categories, maintaining time stamp photos, and capturing precise locations. We provide the evidence needed to justify materials, equipment, and labor used during restoration. We are integrating Crisis Track also with WebVOC, so emergency operation centers can monitor damage and fill activity live.
Leadership gains clearer situational awareness where inspectors are aware, how damage is distributed, which feeder are most affected, and how restoration plans are progressing. In short, this configuration strengths Loom ability to respond quickly and safely, accelerates restoration decisions, support federal documentation, and help us serve Puerto Rico when it matters the most. With consistent data from the field, efficient validation by engineering, and coordinated planning by operations, we can restore power faster, and we will do it with visibility and rigor our customer and communities deserve.
Thank you so much, Maria. It’s great to see that leveraging the tool to put together these reports and putting all of this effort into, getting the right information to the right people and with the correct details that are needed in order to be able to expedite and create a better flow of documentation for reimbursement and assessment. That’s really great to see. Our next question here, how much does validated damage assessment improve restoration beyond documentation? I guess we’ll have, Elriberto.
Good morning, everybody. So Ediverto Gonzales here with Luma Energy. I know Michelle at the very beginning of the call. She mentioned a couple of terms that we use here, like, and she also did mention a couple of the benefits of having a validated damage assessment through that question.
But let me, you know, if I can run, I wanna give a little bit of context to the audience here about, you know, how things are being done here in Puerto Rico. LUMA is the only one electric utility in the island. Right? We are the operator of the electrical infrastructure, a T and D system that includes substations.
And after any major event, you know, we sent our internal teams and contractors to complete the detailed damage assessments. That information that is captured from the field goes into the Puerto Rico official system. It’s called PRIDA, Puerto Rico Initial Damage Assessment. So the PRIDA put together impacts from across all the island.
That includes electrical, water, municipal infrastructure, you name it. So all damages in Puerto Rico goes into that database. And in our case, as Luma Energy, we submit the damage on the electrical infrastructure. So once everything is in Prida, the Puerto Rico Emergency Management Bureau use all that information to submit at a statewide level the initial damage assessment that eventually goes to FEMA as part of the public assistant initial damage assessment that some of the participant of this webinar may be used to from the mainland side.
Right? So the flow looks initial assessments from LUMA, PRIDA, then emergency management, then FEMA, and then public assistance. So now, beyond just documenting the requirements, right, a validated damage assessment does make a huge impact operationally wise for us, right? So when when we have this information coming from the field that is accurate and verified, we can get real time reliable picture of what’s actually happening and what the damage and how severe it is in the system.
That is because it let us deploy crews more efficiently across the island, move materials exactly where is needed, and prioritize the feeders and assets that needs to be restored in the system in order to get people back in service. So it is not just paperwork. Right? It directly changed how the restoration unfolds through the whole disaster recovery efforts.
It helps avoid truck rolls to similar location. It kept our crews safe by giving them a clear understanding of what’s happening and what the situation is in the field. It improved the coordination across multiple segments in LUMA, so that involved operations, logistics, engineering, and emergency management. Another one of the biggest advantages that we can see from detailed damage assessments are the estimated time of restoration.
Very important anywhere in Puerto Rico and in the States. So having a validated damage assessment, it eliminates the guessing of how long it’s gonna take to restore a customer. So with the diesel damage assessment, we are able to provide accurate estimated time of restoration because now we know the workload that is required to correct that situation out in the field. So in a nutshell, you know, validated damage assessments, it takes their raw field observation and turns them into actionable information that speed up the restoration and make our communications very strong with the customer at an entry level.
That’s great to hear, Eddie. Everto, and it’s important to have that kind of consolidated approach and good communication to be able to handle these kinds of events and be able to restore power, adequate time to your community members. So it’s great to hear that type of validated damage assessment really does help improve your operations as a whole. Last question here for for you all is what advice would you give another utility preparing for its next major event?
You know, at Luma Energy, we have been operating the system and maintaining the electrical system here in Puerto Rico for over five years now. Right? We basically started from scratch, and we have done damage assessment different ways. And every year, we have gotten better at it.
Right? My biggest piece of advice for anyone will be to build your damage assessment process before you need it. As I mentioned, we have been consistently building up that system to where it is right now, but having before you actually need it is critical. Right?
Train your crews, train everyone in how to collect this information on the same way, be consistent on how you are collecting assessment, and have a digital tool that is ready and make it easy to capture and share the assessments in real time. And make sure that you have the simplest workflow as possible so the incoming information that is being received from the damage assessments in the field gets validated very quickly and consistently too. Doing that, it helps you keep your asset records up to date as well, including pictures, baseline documentation of the assets. So when you are able to compare before and after, especially for the FEMA damage process, everything is very straightforward and defensible.
So you have all the information that is required for reimbursement, and you don’t need to go back and reassess and do certain things because you already got a tool that is able to capture all that. Doing all that ahead of time, it does help the utilities, like I mentioned before, restore service faster, communicate very clearly with customers, and move things through the recovery and funding process with a lot less stress than we have seen it before.
Thank you so much, Arrivedo. We do have a next section here, but before we go to it, I know, Michelle, it seems like you have something that you wanna add as well.
Just wanna add to what Eddie Berto mentioned. His focus was LUMA, but part of the lessons learned that we’ve had just as important, in our case, developing a video here because we are not part of the mainland, we rely on what we call preposition contracts. So we have contracts that are written and already signed with companies both in Puerto Rico and also in the states that are eligible to do work for federal funding. And so part of that process is also the fact that we’ve taken our processes for damage assessments and taken our training and created a modular video because, again, if you’re gonna bring contractors to do damage assessments, they need to be using the same tools and the same process that you’re using. So, again, the lessons learned from, in this case, hurricane Ernesto, where we did activate some of the contractors. It doesn’t do you any good to bring contractors in to do damage assessments if they are out there doing their own thing.
Gotcha. Yeah. No. And so that training piece is is a big key. I think that the way that Luma is doing it through these videos that you’ve mentioned is the right move and the best way to be able to kinda demonstrate how you want the information to be completed by those crews that are coming in to assist during these types of events.
Appreciate you adding that as well. With that said, I want to throw it over to our senior solutions engineer, Chloe Jones, who is going to be demonstrating Crisis Track for us here today, some of the capabilities that exist. We had a short demo there with that little clip that Mariel was able to share specifically for how Luma is using WebEOC. Chloe will be just providing an additional layer of depth there so that those who are interested in seeing some of our capabilities can see it at work on this call.
So, Chloe, I’ll throw it over to you.
Thank you so much, Ron. And thank you so much to Luna for sharing your experiences and your insights when it comes to damage assessments in your past experience. So I’m going to give a general overview of Crisis Track in the system, and we’ll probably be taking the next ten to fifteen minutes to look at this to showcase all of Crisis Track’s features and some of the main attractions for it. When we log in to our incident, we do also have multiple incidents that we can go to at once.
So if we need a reenter and hold incident or if we have multiple ongoing ones that we’re tracking damage for, we can track those separately. When I do enter my incident, I’m presented with all of my resources here. If I go to my footprint, I can view all of my preloaded assets. So this is where we can save time by preloading any structures that we would normally run a damage assessments for.
This can contain any type of my infrastructure, so things like my distribution damage and stuff like that. I can also mark the area of concern. So any area within that area of concern, we can see. If I wanna see all of the structures in the area, I can also toggle those on.
And then I have my different levels of types. So if I wanted to see assets of a specific type, let’s say all of my poles within the region, I could filter down to just those details. When it comes to the actual assessments being done, those can be assigned out to individuals, and we’ll explore that, shortly here. But we also can be able to view on the map where all of this information comes from.
So here I can view one of my damage assessment entries. We can view information regarding the asset itself as well as the damage assessment that was done here. People have provided whether or not it has damage overall, the estimated damage cost, and then they can even attach photos directly to the record showcasing any damage that particular asset may have incurred. We can also throughout Crisis Track, there are multiple ways that you can export your data.
So if you ever need to get ahold of it, there’s also multiple tools for address searching or any other features that you wanna use to configure the map, whether that be changing the base layer or even adding some additional layers in. Going back to my incident, I can go to my operations view, and this can be a place where I view my different tasks. So as you can see, all of these blue ones are things that have yet to be reviewed by the damage team. I can click on it to be able to view the main asset details, but as you can see, none of the actual assessment has been performed on those.
Meanwhile, on the left side here, we can see the different things that have actually been assessed. So if I go to one of these entries, we can see what the different symbols mean in our legend over here, what has a status of holding, what is being reenergized, any distribution damage. We can view that directly from this legend. As well as we could filter down.
So if we just wanted to see something of a particular type, we can choose to remove filters until we get to that. Now back into our operation suit, we want to be able to start assigning out our tasks so individuals can start performing those assessments. Here is where we can set up all of the different teams that we have and what tasks are going out. So here, let me also zoom in a bit more because I realize my screen might be wide and might be difficult to read in this instance.
Here, we have our different tasks that are going on, water main, electric distribution line restoration. These can be for any types of tasks that you wanna assign out to individuals. We can also assign these directly to teams. So we’ll also take a look at our team management in a second here.
But on our task itself, we can provide some overall details for this, track whether or not this is active or if it’s been closed out, and then any special instructions that might come from it. If there is a reimbursement category associated with it, we can also provide that here. And then we can choose any forms that we wanna limit that team to utilizing for this particular task. Going over to our team’s information, here’s where we have our actual teams.
We can manage their statuses over here. So if one of these teams needed to be marked as not available or if they happen to be assigned and working, we can switch their status on. I can also edit the team directly, and here we can see the employees that are within it. If I wanted to be able to add employees, I can do so directly from the view itself, as well as I can assign any equipment that might be had and then also tie that equipment to the members of those teams.
Tasks, we already walked through how you can assign those from the task view, but there is also a way to assign those from the team’s view just to make things easy and flow freely. And then once we’re ready to actually perform those assessments, we can go to the actual entries and start filling those out. So I’m going to pull up my phone here, and we’re gonna explore from the mobile app how Crisis Track is utilized. So on the right side of my screen is directly from my mobile device.
The Crisis Track app has pretty much a lot of the same functionality, but it’s streamlined for collectors who are out in the field surveying and actually performing the assessments. It does allow individuals to track them data. So one feature that I should touch and that was touched upon by Luma is the ability to capture offline data. So if you wanted to be able to download your structures, so then the surveyors can access those even when they lose connectivity, you can do that.
And then any data that’s collected during that time, it still gets saved and logged with whatever times that they happen to perform the assessment. And then once they receive connections, it happens to push back into Crisis Track where everybody can view that information. From our demo incident here, we can choose whether we want to collect our data or track our resources. I could say collect my data.
I wanna move to my damage assessment team one here, and then I get to select the different tasks that are assigned to me. So in this case, I would be performing my distribution line damage assessment. We can start our tracking. So while this is active, this will basically allow us to mark that and continue.
So now we are actively tracking our information. It records both our location as well as any of the time we work so then that information can be collected later. Here we have our actual assessment. So here we have our structures.
We can choose to locate them. Here’s all the information associated with them, and then where we perform the assessment towards our forms. So if we wanted to be able to assess one of these, we could choose to access that information here and then send that back to Crisis Track. We also have a map that we can utilize.
It shows us our location as well as things in our area. So as we happen to get close to any of our particular assets, it might be easiest for us to locate and verify these on map itself. And then we, of course, have a place for stats so we can see how many we still have, how many have been completed, and the different classes that have been marked here. And now I’m going to stop tracking.
We can view and edit the entries as well without tracking if we wanted to, but anything that I collected during this time will be captured so that when I go back to my desktop view here, we can go to our personnel records. And here we can see any of the individuals that are logged in, what their different time collections are. So here we can see ten hours, eight hours, eight hours across these days. I can also happen to go to my documents or even my tracks.
So if I pull up my tracks, it will show me all of the individuals within the regions. So I can see, like, what zones they happen to be utilizing. And then if I wanted to pull together my two fourteens, I can go to my two fourteen here. And here we can see the different individuals that have logged in and we’re tracking their information during this time.
And then any of the assessments that were performed from this team happen to be added to our activity log. So we have a full running log of when certain items were assessed, and it gives us that full accountability back. A few other features within Crisis Track happen to be the ability to view your photos as well as your call center information. So if you do have a public assessment line where people can report public damages, you can assign forms out to your call centers, and then they can start filling out information for those, identifying structures that happen to be close to the caller’s reported area, and then providing some high levels information that could help perform assessments upon later.
There’s a variety of other means that you can use to help administrate and run your system, but I will go ahead and let up on the demo so we can go into questions and other topics.
Thanks, Chloe. I’m gonna go ahead and share my screen again. The question was, how do you currently capture damage assessment information? Actually, it’s eighty percent now using a mixed approach and twenty percent using photos and emails. I’m gonna go ahead and end that poll, Ron, and start the next poll. It’s our last one. So this question, how much does well documented damage assessment improve your ability to provide accurate estimated time of restoration, ETR updates?
This question is important based on what we’ve just gone through here. I think that because there is a bit of a mixed approach from our audience, what I’m noticing is that in taking this kind of approach, it may not be clearly evident how your ETRs could improve. So I know that for some folks, this is going to be a bit of a guess. But the truth is from what we’ve seen and what Chloe and Luma were able to show, it really can make a significant difference, improve the overall quality of damage assessment to have a tool that consolidates information and then is able to accurately and separate this information by incident across different responses.
These types of severe weather events don’t just happen once. Right? They’re quite frequent over these last few years. Right?
Since, I think it’s like twenty sixteen, twenty fifteen, we’ve been going through hurricanes and tropical storms on quite a frequent basis. Perhaps a mixed approach is what folks are doing now, and they may not be aware of tools that exist to be able to streamline that such as Crisis Track. I’m very happy to show on this call. I’m very thankful to both Luma and Chloe for doing a great job of showing the overview of what a tool like this is capable of doing.
I do have one question from the group, Ron. I’m gonna go ahead and ask that. What information do decision makers need most during the first twenty four hours of an event.
So in our case, in addition to having a people process technology for damage assessments, we also have worked based on the Puerto Rico Emergency Management Bureau guidance and federal guidance, our critical infrastructure, our critical customers, critical loads are. So the incident commander, as soon as clear, you know, the focus is, you know, what are those transmission lines, substations, and distribution and feeders that are associated with that critical infrastructure such as hospitals, our aqueducts assets, the helicopter flying, capturing damage assessments on transmissions, and being able to see the degree of damage and how quickly we can restore so that we can get those critical facilities up and running.
Thank you, Michelle. Next question. Where do handoffs between field crews, the incident management team, emergency operations center most often break down? So handoffs between field crews, EOC, and IMT. Where do they most often break down?
So before I revert those on, I think one of the things that we have leveraged on Crisis Track is that the field crews do the damage assessments and they hit complete, but that information then comes to our emergency operations center where we have, I’m gonna say, higher level engineers who actually look at the data and the pictures to be able to move a damage assessment from status of complete to a status of validated. Because if it’s not validated, then it needs to be returned to correct whatever issues are not there. It’s very hard to work a damage assessment that it’s not complete.
Go ahead, The flow of work is as Michel indicated.
Right? So there’s an engineering team here at the central offices that they process all the incoming damage assessments. And until that engineering team does not validate or certify that damage assessment is not captured as an official damage assessment and everything is done through the tool itself. Like I mentioned on my response, the damage assessments need to be accurate. There are situations out there in the field. There are existing conditions, pre disaster, that sometimes may come across as part of the damage assessment, but not necessarily a requirement to put the system back in service nor are an impact related to the event itself. And that’s when the engineering team comes into function to validate those assessment to ensure they are good assessments, that they have the information that we need, and that they are required to put the system back in service, and that they are in effect a result of the disaster that may have happened at that point.
Thank you, Roberto. Thank you, Michelle. Last question for the group. For a utility beginning to modernize this process, what is one practical first step you would recommend?
I tell myself this every day. People process technology. There is a tendency to go after technology as the remedy of all. And if you don’t have the right people and the right processes, technology by itself is not gonna get you where you need to.
And I say that we had our own lessons learned when we started in Fiona. We focused on technology, and it wasn’t until probably a year later when we saw how many things we could not submit for reimbursement that we realized that we had left the other two pieces out. In our case, we are regulated by the energy bureau, and so one of the mandates that we had from them was to put a complete appendix to our emergency plan just on pure damage assessments. It’s a people process technology flow to get to where we are today, and we still have work to do.
Thank you very much, Michelle, for that insight. I think it’s very important to always make sure that, you know, whatever technology is put in place, it’s supporting those other two pillars that you’ve mentioned there, people and process, and that it’s focused on making, in the case of people, enhancing what they currently do, making their process a more streamlined entry and more streamlined approach. Appreciate all of the work that you all have done as well as sharing that valuable piece of insight for members of the utility community. Thank you very much.
With that, we’ll wrap it up. Thank you all for attending. We appreciate it. Thank you.