Use JAI to help you locate and summarize key information in the course of daily operations or during an incident.
Here, let’s imagine I’m an emergency operation center manager looking to get the statuses of shelters during storms and flooding. When I search for how many shelters are currently open, JAI quickly returns an answer.
Below all of JAI’s responses, you’ll see a thumbs up and a thumbs down, letting you share if a response was helpful. Indicating whether a response was helpful will train JAI to give better responses in the future.
Next, I’ll ask JAI to give me a comprehensive list with all shelters that are open, including their addresses. This helps me not only view the data, but export it and share it with local partners who can guide residents to available facilities in their area.
Finally, with this particular use case, I’ll ask JAI to also give me a visual representation of the data it’s provided. JAI creates dynamic visuals that help keep stakeholders better informed. Here, I’ll ask JAI specifically for a pie chart that not only shows me open shelters, but the status of all shelters. Note that I can similarly export this visualization, and I can email it directly to stakeholders, or copy and paste it into a presentation for briefings.
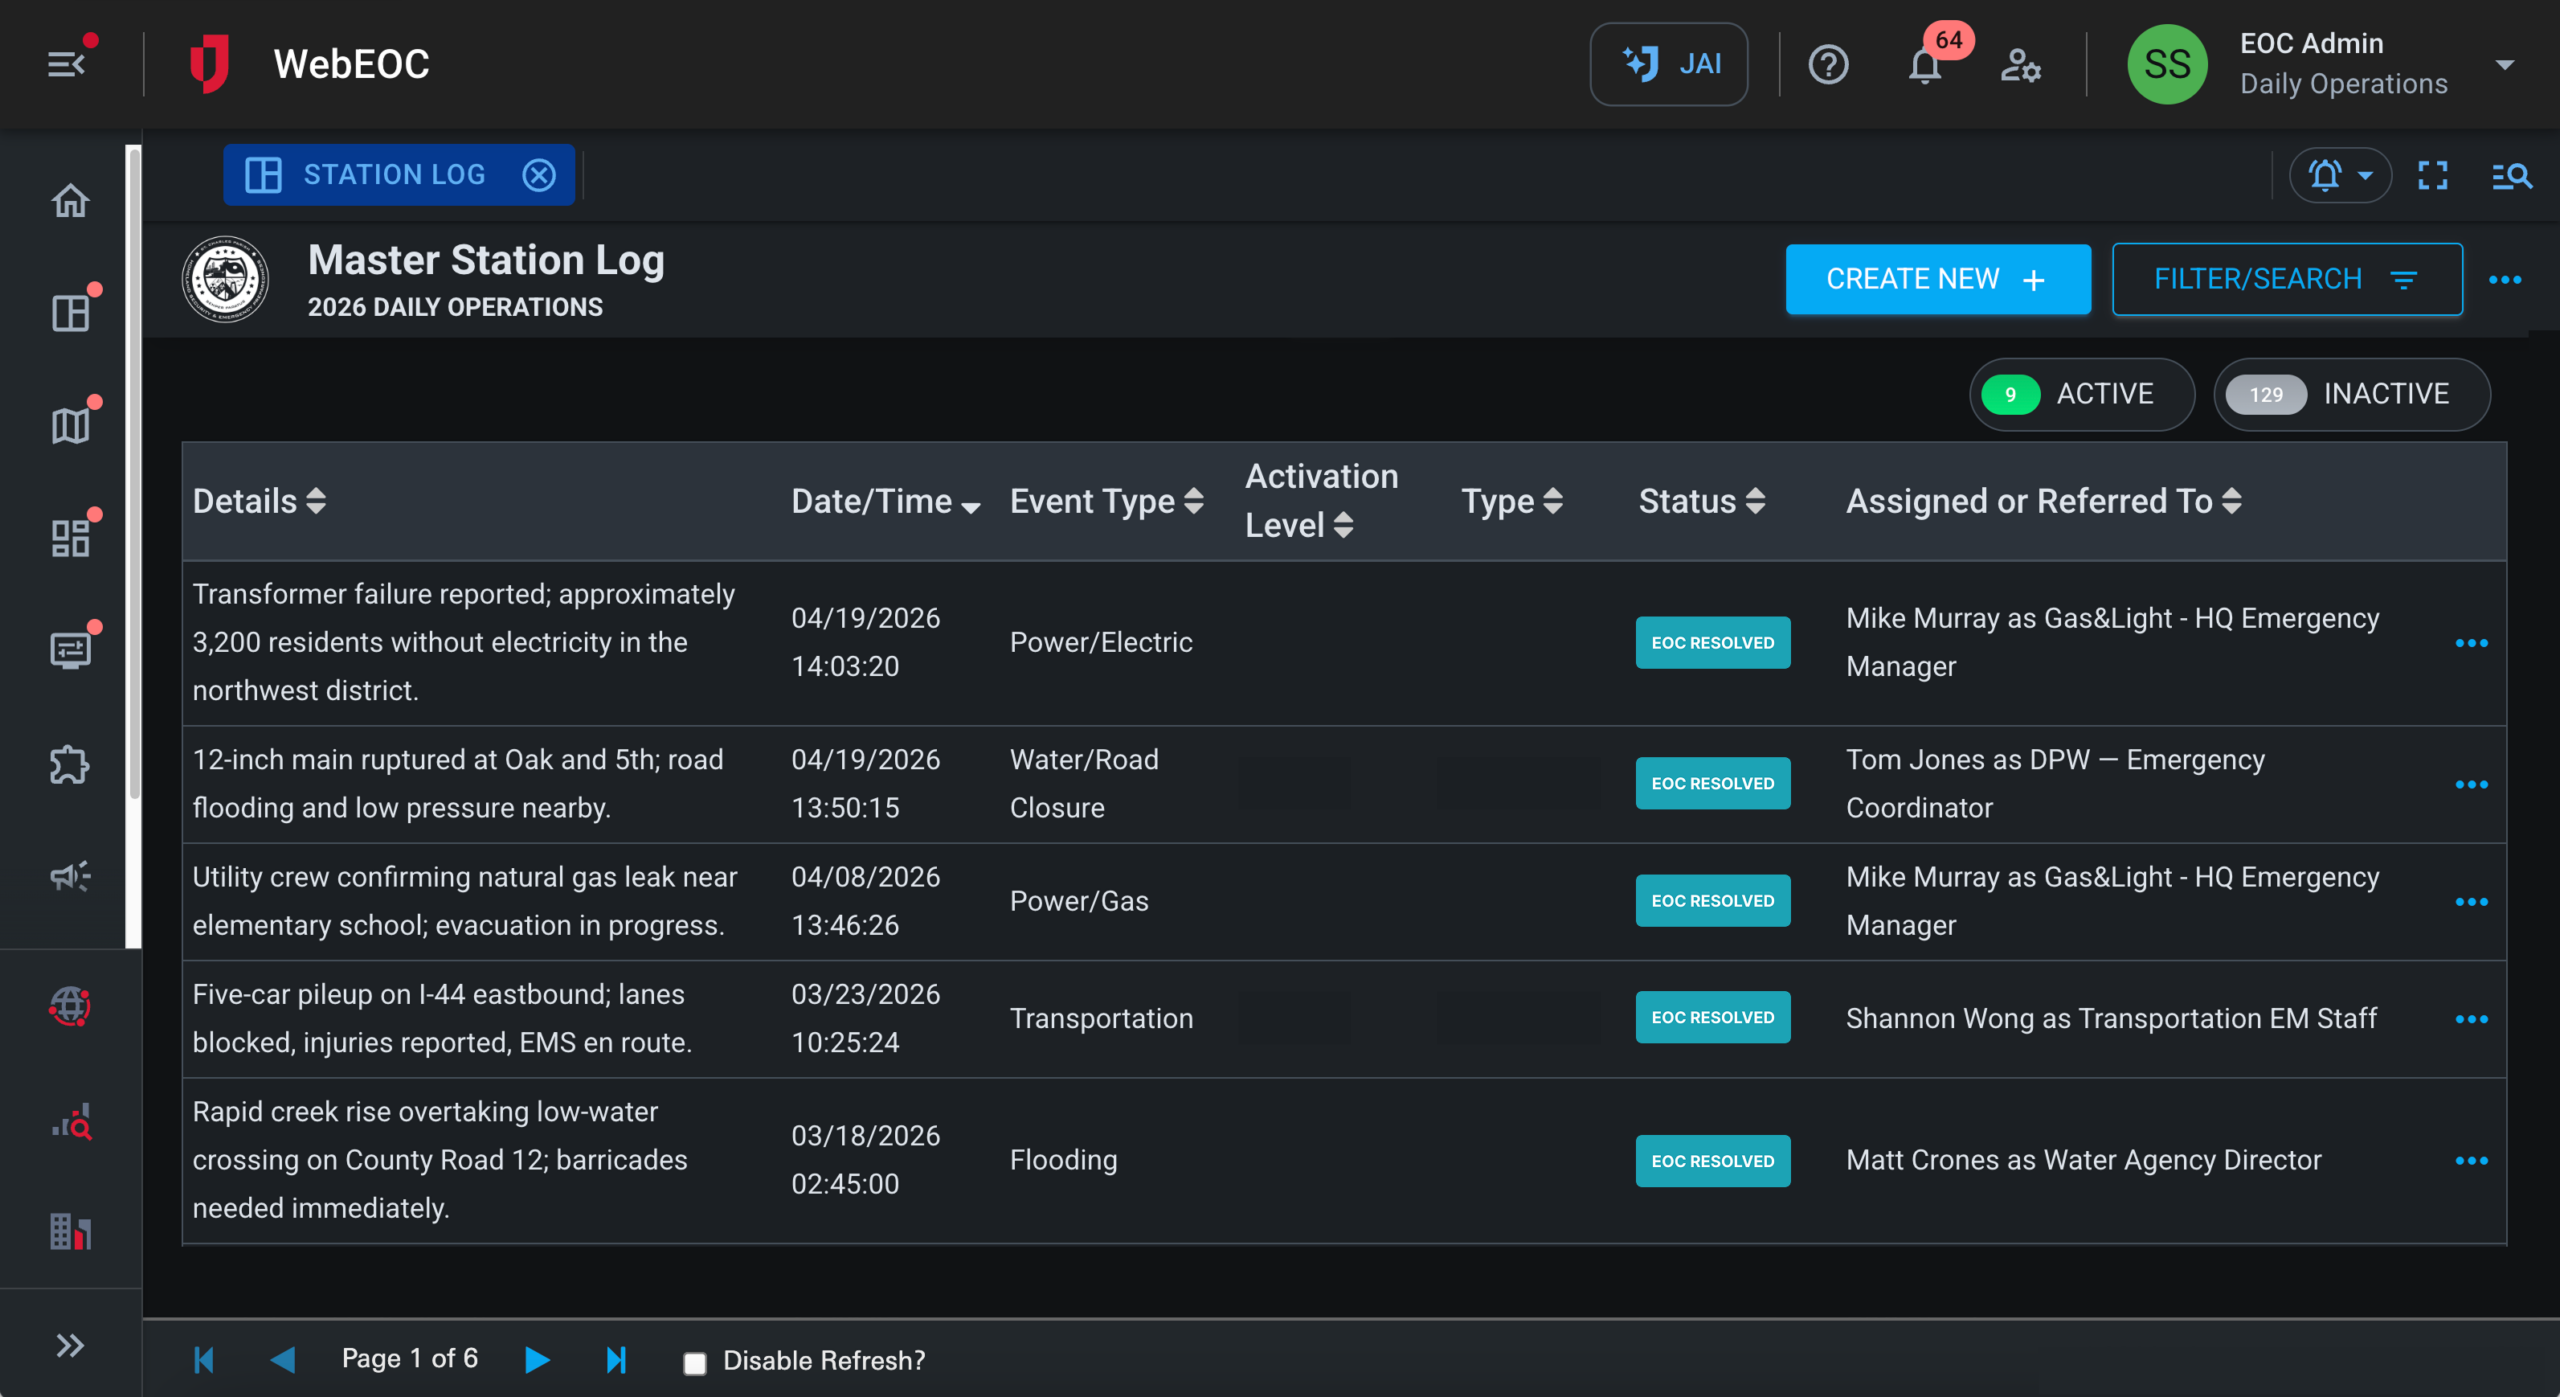
Let’s now look at a different use case with JAI summarizing large amounts of data, especially useful for leadership updates. I’ll start here by selecting requests and tasks, which pulls data directly from my requests and tasks board.
By selecting executive brief from the list of quick prompts, I’m quickly presented with a list of all outstanding and recently completed tasks with additional details. Next, I’d like to have JAI build on this summary with a cost analysis of the resources that are part of these tasks. You’ll see that JAI returns the costs of particular resource requests, including information like the vendors where the particular resources will come from.
Again, for the best possible insight and to keep stakeholders informed, I’ll take advantage of JAI’s charting and graphing functionality.