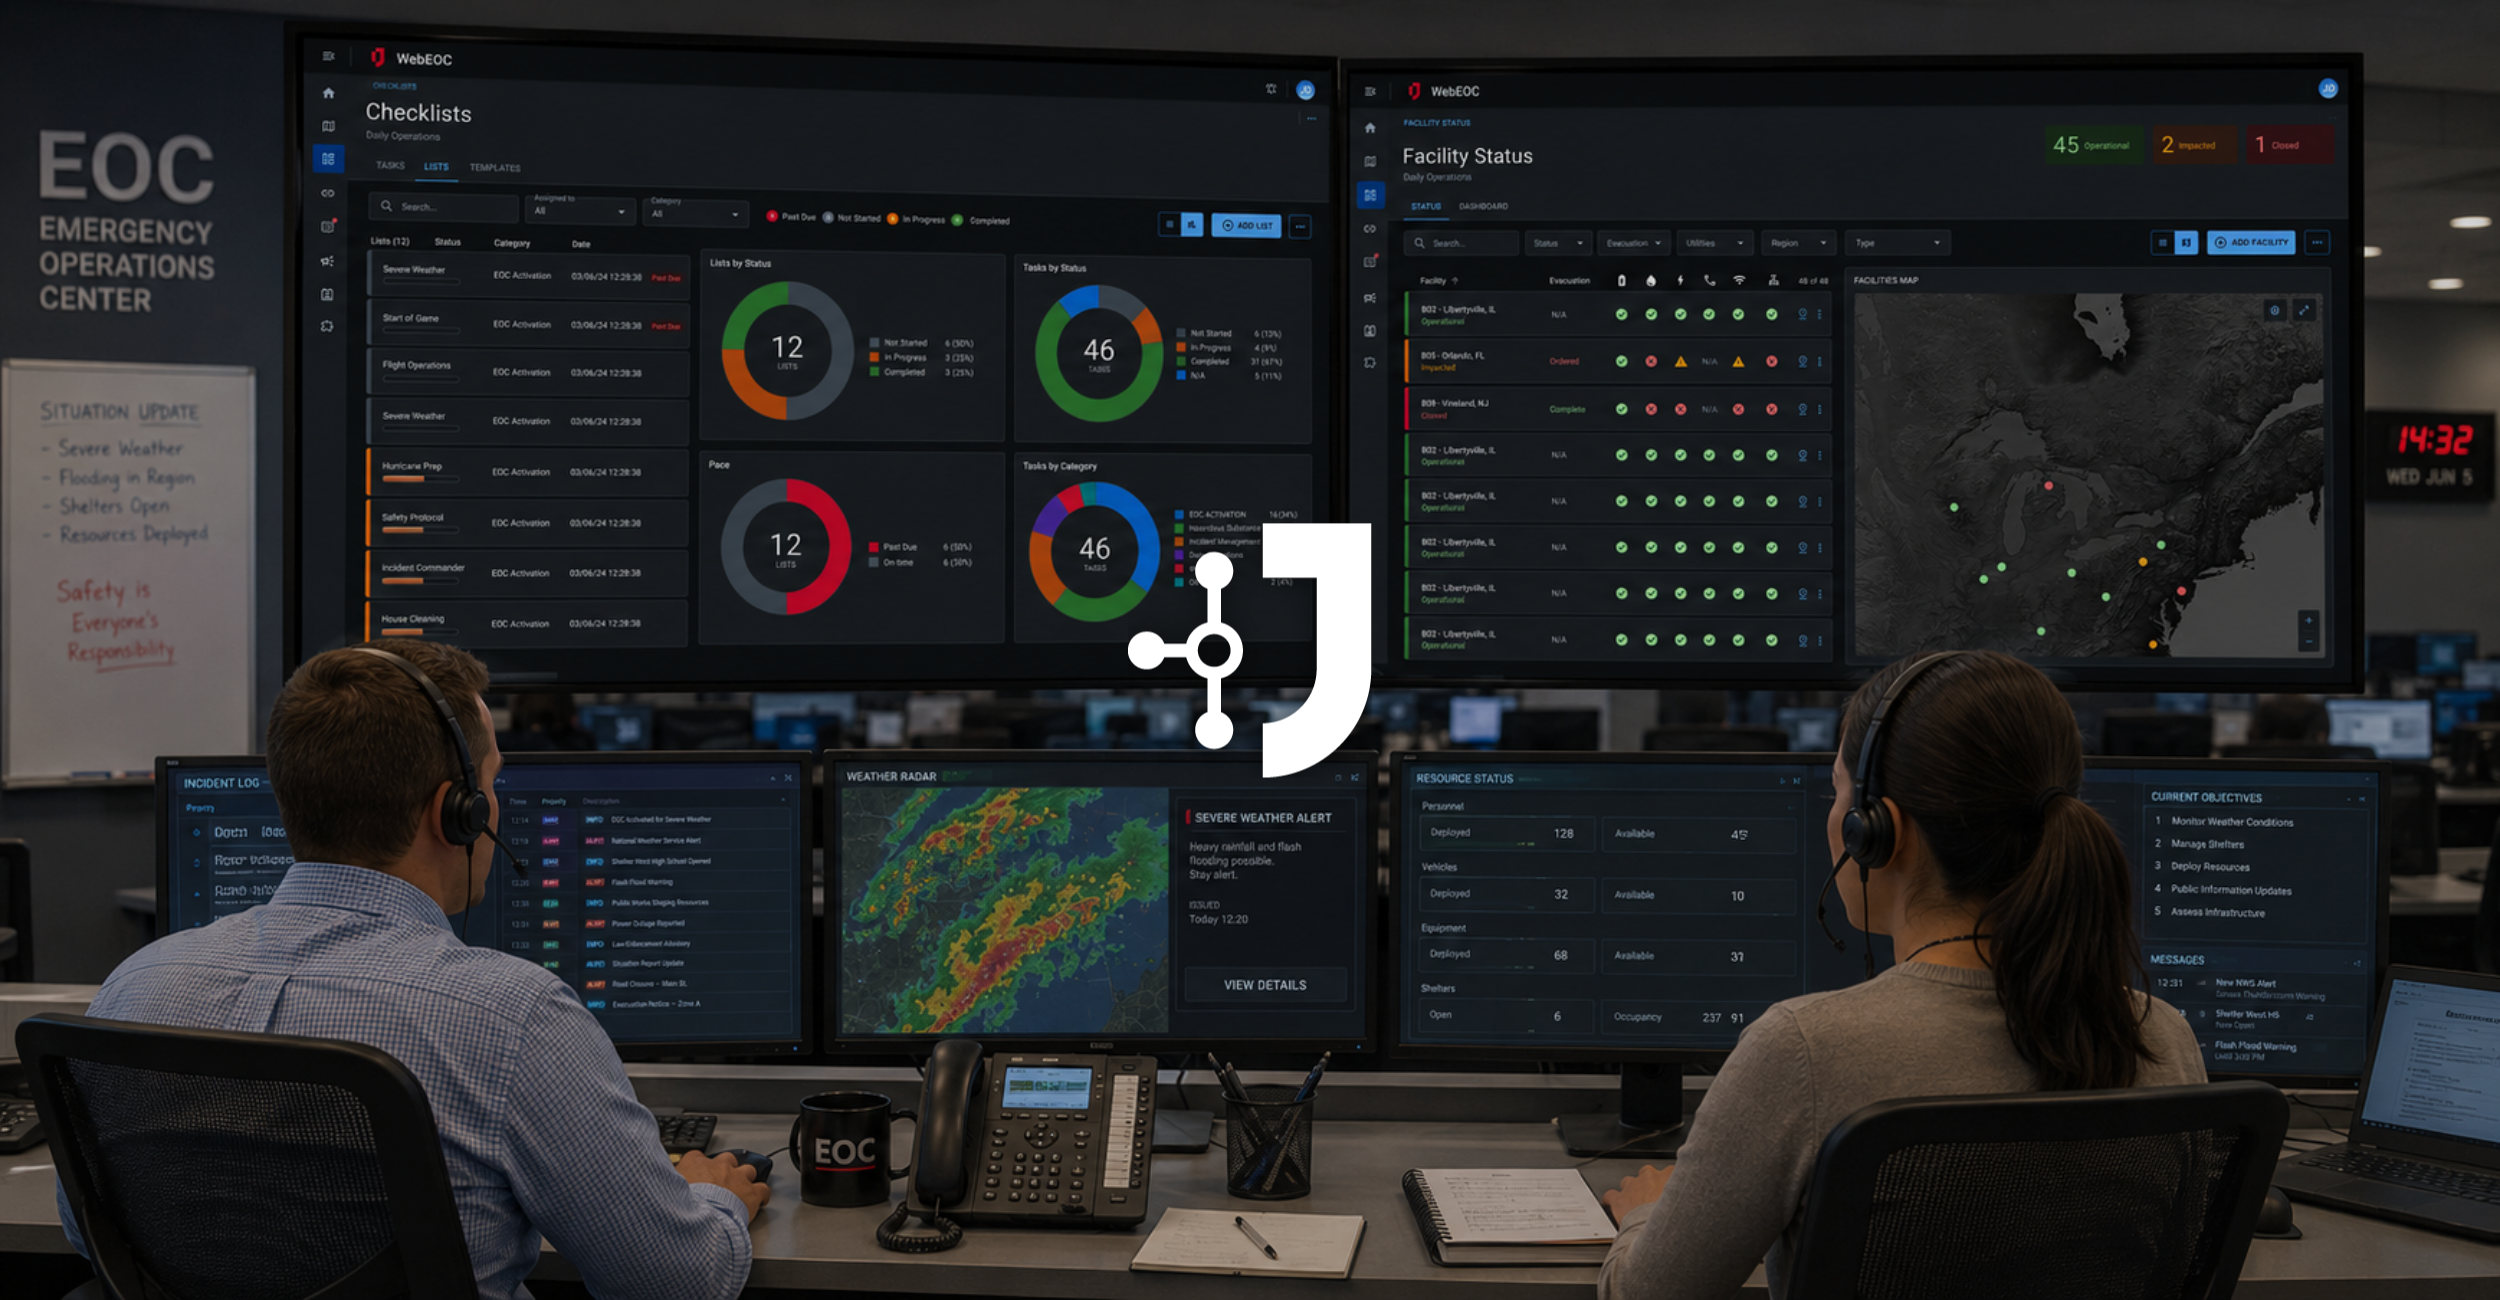

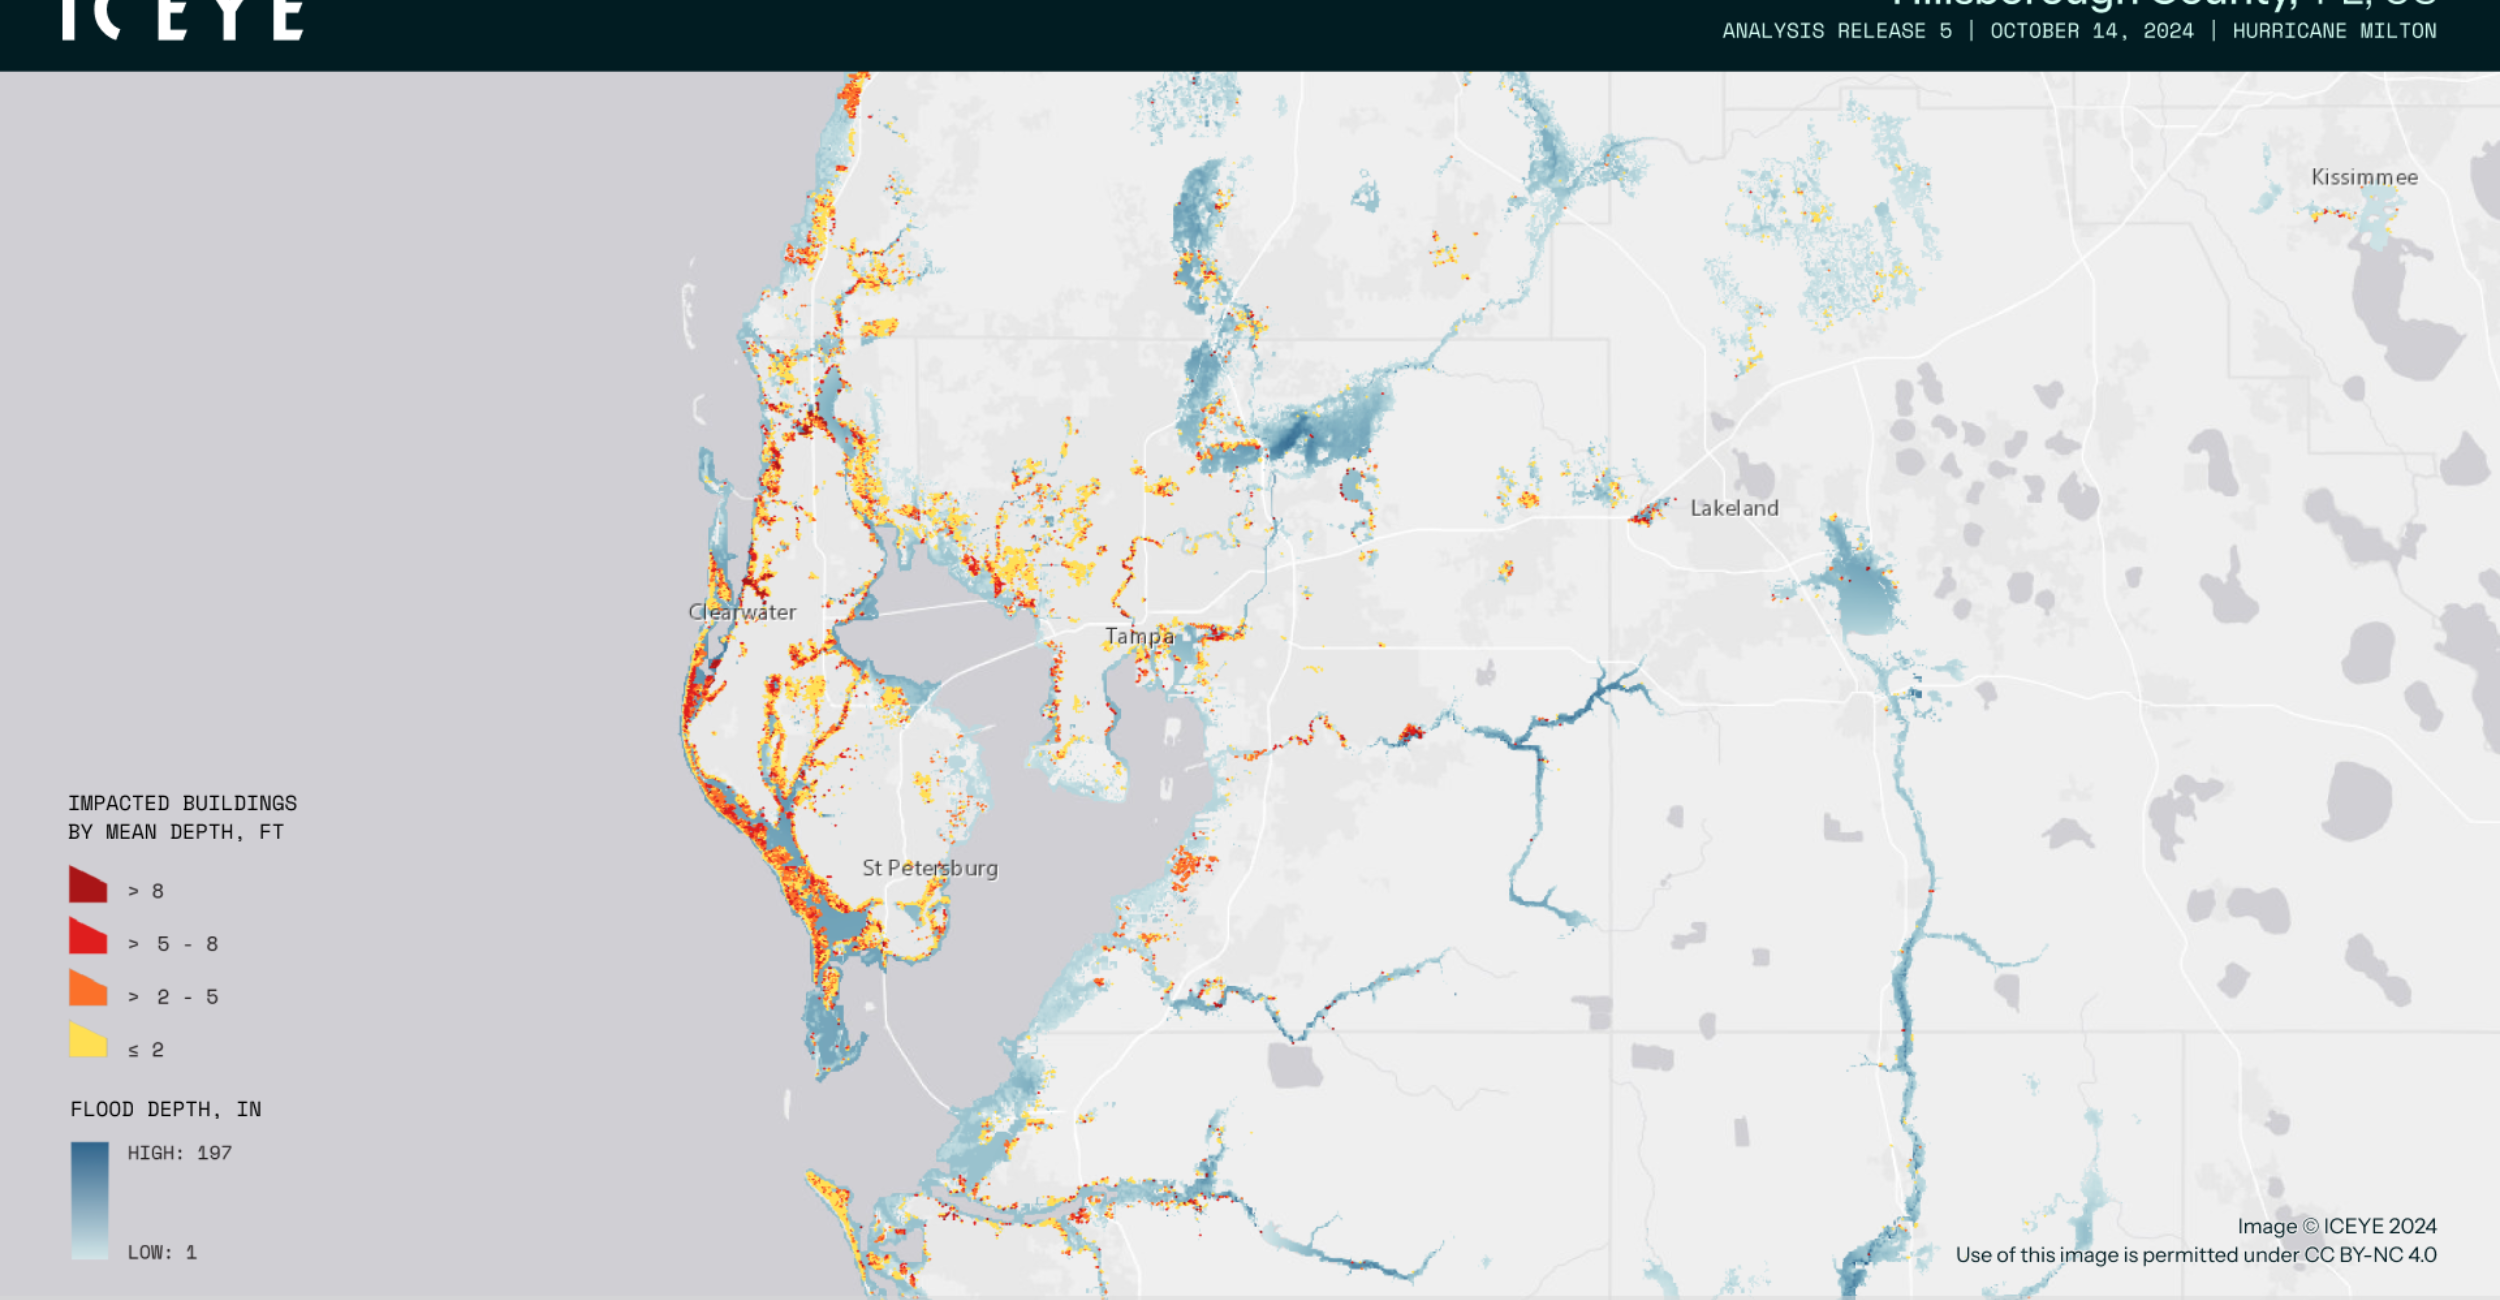
This webinar explores how satellite-powered technology, specifically synthetic aperture radar (SAR), is transforming flood response and long-term resiliency in Florida. Featuring experts from Lee County, the Florida Division of Emergency Management, and the South Florida Water Management District, the session demonstrates how ICEYE’s satellite data integrates with WebEOC to provide a common operating picture. Panelists discuss real-world applications, such as using real-time flood extents and water depth during Hurricane Milton to improve first responder safety and decision-making. The presentation also covers how these geospatial insights support long-term resiliency planning by refining hydraulic models and providing the technical documentation necessary to justify federal and state infrastructure funding for flood mitigation projects.
# Transcript
Today’s webinar is how Florida is leading the way in satellite powered flood response, recovery, and resilience. Today, we’ll be sharing operational perspectives from South Florida Water Management District, Florida Division of Emergency Management, and Lee County. Let’s welcome today’s speakers. John Schultz is Chief Emergency Management Department of Public Safety in Lee County.
Daniel Rydl is GIS Administrator, Information Technology Management Bureau, Florida Division of Emergency Management. Carolina Moran is Chief of District Resiliency, Division Director, flood control and water supply planning, South Florida Water Management District. Mike Bennett is head of government solutions North America with ICEYE. Gretchen Chiquaz is senior solutions engineer at ICEYE.
Matt Cronin is our VP of solutions engineering here at Juvare. And I’m Jeff Rikovich, director of partnerships at Juvare. Our agenda today, we’ll start with an introduction of Juvare, followed by an introduction to ICEYE, then insights from our panelists. We’ll see a product demo of the ICEYE product, followed by an integration of ICEYE and WebEOC.
We’ll see a demo of that. We’ll have a panel discussion, q and a, and we’ll wrap up with how to learn more. Before we dive into today’s topic, let me briefly introduce you to Juvare for those of you who may not know us. We’re the leading provider of emergency management response and preparedness response and recovery.
We are trusted by government agencies, health care organizations, higher education, critical infrastructure, and corporate security teams. Our mission is simple. We make organizations more resilient by anticipating disruption, protecting people and assets, and enabling a coordinated response. Before, during, and after an event, Juvare provides the technology and the operational picture needed to make faster and more informed decisions.
To date, Juvare has supported more than five hundred thousand emergency incidents across the US states and twenty countries. We’re trusted by thousands of hospitals in more than a thousand local jurisdictions. So that’s who Juvare is. Let me turn things over to Mike Bennett to introduce ICEYE.
Yeah. Appreciate it, Jeff. ICEYEis a new space company devoted to deploying the largest fleet of what are known as synthetic aperture radar satellites globally. So we have launched nearly eighty satellites as of July this year.
We’re expecting to launch another fifty to a hundred or so satellites over the next twelve months. And that goes back to our first satellite launch, which was twenty eighteen. Big part of the business is devoted to the technology behind those satellites, improving the way that we incorporate that data, develop the sensors on our satellites. We have over a thousand people at the company, but there’s also a significant part of the company that’s devoted to utilizing that information from those satellites and applying it to natural disasters.
And so if you look globally, we’ve analyzed more than four hundred floods over the last five years, more than eight hundred wild fires, and those numbers continue to increase day in and day out. I wanna talk a little bit about exactly what SAR is. We can go to the next slide. And what the benefits of synthetic capture radar are.
So synthetic capture radar, or SAR for short, is a sensor that sees through clouds and it sees at night. It sees through smoke and ash and wind and rain. So when you deploy that on a large constellation of satellites like ICEYE has, you’re able to have visibility to what’s happening on the ground regardless of atmospheric conditions, regardless of day or night, and with frequent revisits. And so that gives us advantages over other forms of remote sensing because we can capture the full scale of a disaster.
You can capture the progression and the peak of that disaster, and you can do it more reliably, more predictably, and with a greater speed of delivery ultimately to our clients. The way that we first do it though on the solution side of the business, which is the part of the business that’s focused on delivering information and insights on natural disasters is we have to actually monitor for them. So what I said, we have a team of meteorologists that’s located globally, and they are operating twenty four seven to forecast for hazards like flooding or fires or hurricanes and typhoons and ultimately deploy our satellite constellation to capture those.
So this is a look at system that they’ll use in order to deploy the imagery and a look at just how many events that scale that we’re capturing. Obviously, quite a few fires right now that the team is monitoring and analyzing across the Pacific Northwest and the West Coast. Once we have captured or started to capture that imagery, then we start to work with other parts of the solutions business. There is a part of the business that is focused and devoted to just capturing, geolocating and sourcing information, any auxiliary data that comes to flooding.
They may incorporate river and tidal gauges or digilevation models or open source images from news reports or government sources or social media, ultimately wrapping all that in with our SAR imagery to produce geospatial insights. The final part of what we do is we deliver geospatial insights. And these geospatial insights allow the end user to not have to look at SAR imagery, which is a unique terminology and kind of difficult sometimes to ascertain exactly what you’re trying to see. But ultimately, create maps, ultimately allow our users to intersect their critical assets, their infrastructure, their buildings, where their citizens live, and where their stakeholders live and operate with our flood insights or with our wildfire building damage assessment data or with our hurricane insights to assess what the impact is within their jurisdictions.
So for today, we’re gonna go through each Lee County and then Florida Division of Emergency Management and then finally South Florida Water Management District to understand the real world use cases of ICEYE’s data, especially when combined with WebEOC, operating what the challenges are both before IceEye data and then as ICEYE and WebEOC data come into play, and then what key decisions having access to that data enables. First, I wanna introduce for Lea County, John Schultz, who’s the chief emergency management department of public safety, to go through a little bit of what their real world use cases of WebEOC and iSight.
Good afternoon, everyone. My name is John Schultz. I serve as the chief of emergency management for Lee County. Today, I wanna share with you some real time data that we bring into the emergency operations center.
It’s more than just technology. It’s about the decisions that the data helps us make. I’ll quickly cover some four key points, how we added new capabilities, the gaps we wanted to address, and what happened during hurricane Milton, and the decisions that we can make with the real time data. As I speak, you’ll see a couple of slide ESRI layers that were created from eyesight data during Hurricane Milton along with some watermarks from one of our local areas that was flooded during Hurricane Milton.
I’ll begin with how we do things in Lee County. Rules are only useful if we get into the habit of using them early. Lee County Public Safety makes a point of using new technology in the field before it becomes standard. We do this in every division, not just emergency management.
Our weather stem network shows us surface conditions right where we need them. Instead of regional forecasts, we see where the wind and the rain located in each neighborhood. A whole new tidal gauges provide real time water levels at spikes that flood first. This is actually measured and not a model.
And with our drone first responder program, we get an aerial view of the scene before our teams arrive. This gives us a faster awareness and a safer way to approach when the situation is uncertain. We also process these real time data streams with ArcGIS velocity. This way the EOC gets a clear up to date answers instead of a flood of raw information.
In short, Lea County is quick to adopt new tools, and we make everything work together. A sensor really is no good if it doesn’t have that capability. What exactly we do to make it better? We have two main gaps to address.
The first is timing. Traditional damage assessment relies on windshield surveys and field reports, but those can’t begin until it’s safe. So during the first twenty four to forty eight hours when we made staging and life safety decisions, we often had the least information. The second gap is terrain, which is unique to our situation.
Hurricane Ian didn’t just damage Fort Myers Beach in twenty twenty two, it changed the ground itself. Dune lines, elevations, drainage paths no longer matched the models to our knowledge before Ian’s impact. This has a serious issue for public safety because it’s based on our understanding of how the water flows, and it since has changed. Our goal is clear, understand how water moves across our landscape, and we need to identify those problem areas before we send people in and avoid putting first responders in situations that we couldn’t have predicted.
This is how it played out during an actual event, Hurricane Milton. We arranged for our iSize subscription ahead of Milton’s landfall. This step mattered because adding new features during an event is very challenging. During the incident, WebEOC served as our only system of record.
We kept our resource requests, our situation reports, our damage assessments, and our section level tasking all in one place instead of spreading them around across emails or phone calls. Milton was also one of the first real tests for our coastline since the end, and so we combined iSize satellite flood observations with ground data from our Honu water level sensors and our weather stems. This approach showed us where the water was actually going, not just where our pre EN assumptions predicted it would go. When we compared this information with the National Weather Service products and our REOC had the reliable picture of the impact in just hours rather than days.
The main lesson is that no single source was enough. The real value comes from combining sources and having a single place to organize them. I wanna explain what iSci does for us because it plays many roles. First, iSci helps us with documentation.
The observed flooding extends provide time stamped independent record of what areas were flooded and when. This supports our damage assessments, reports, and reimbursement claims by using solid evidence rather than relying on memory. Second, iSci helps our teams on the ground. When crews enter flooded areas, they rely on real observations rather than guesses.
We can compare the imagery with our sensor data and send people only to places that need verification, not everywhere. Third, when we brief a municipality or a partner agency or the public for that matter, we can show them actual observations that support our guidance. And lastly, having the data allowed us to make another important decision. We stage resources differently based on real time water levels and observe flood areas.
This lets us send high water vehicles, swift water teams, shelter support to where flooding is happening, not just along the Picton storm path. Without this information, you only have two poor choices. You can play it safe across the whole county, which spreads resources too thin and puts responders in unknown situations, or you can wait for better data and lose valuable time. Neither option is a real decision.
It’s just basically a default decision. This data also helps us make harder decisions such as telling a partner agency or a city that we are not entering a certain area yet, and we can show them the evidence to support that. What we are really gaining here is not just efficiency, it’s the safety of our first responders. And that what separates an opinion from a real assessment.
In our line of work, that difference means everything. Because what we are really getting here is not just efficiency, it’s reinforcing first responder safety. Every probable event, flooding event adds to our record of flood extents, and over time, we see how the landscape has changed since the end. This information guides us on our planning for reentry, mitigation, our capital decisions, and all these things are supported through the eyesight data that we are collecting.
We began using the methods as soon as possible, try to combine the information rather than just gather it, and always check the conditions before sending anyone in. These four slides, like I said, are ESRI layers that were created from ICEYE data. And the last slide here is some, watermarks from, Boca Grande and Upper Captiva and a flooded roadway out on, Boca Grande.
And I think it’s clear, you know, Lee County is a leader as a county implementing technology.
How would you say technology has changed the way in the last few years alone that Lea County responds to disasters.
We flew some drones out to the barrier islands, and then we pumped that feedback into the EOC. And our video board, we were able to show not only decision makers, but also our board of county commissioners real life’s happenings on Bay Area Island. What the needs were for the community, what our first responders would need, and quickly getting resources out to that area. One area in particular, we had a bunch of sand over one of our one roadway that is the only way in and out. So we were able to mobilize a front end loader very quickly because we already knew the situation was up there because of what we were visualizing through the new technology.
Awesome. Next, I wanna introduce Daniel Riddell. Daniel is the GIS administrator, information and technology management bureau at the Florida division of emergency management for FDM’s use from a GIS perspective of ICEYE and WebEOC. Daniel?
So the first thing I wanna discuss is that, you know, we’re talking about two things here. We’re talking about ICEYE, and we’re talking about WebEOC. And I’d like to illustrate how we use these two in a very particular scenario. So during an event, any event for that matter, but in this case, we’re gonna hone in on tropical weather.
One of the first hurdles, one of the most important tasks that we have, in particular FDMGIS because we’re really instrumental, is building what we call the COP. It’s the common operating picture for state, federal, local partners, the state emergency response team, and every single person that’s involved in responding to a dire critical event. The common operating picture is a mixture of information and intelligence that is gathered over time that populates the theater. As an event unfolds, it starts modest and it grows in scope and size, the elements that’s contained in it.
The relationship between WebEOC and iSIG is a very direct one. The common operating picture right out of the gate utilizes WebEOC’s GIS capabilities, the GIS connector, and we use WebEOC to feed information to other critical information that we have in GIS and take those relationships and intersect them and create intelligence on the fly as events go. For the WebEOC users out there, especially the ones that are using the GIS capability, what you’re looking at is a live look of assets, a live look of the staging of personnel and equipment that goes into WebEOC, feeds out of WebEOC into ArcGIS where we make that relationship and then we populate the cop.
So it’s a perfect example to put ICEYE in WebBLC in the same discussion. What ICEYE excels at helps solve what we’re calling my problem here. One of the biggest hurdles out of the gate when you’re responding to an event such as a tropical system is that information immediately after impact is traditionally it’s not necessarily slow, but it gathers steam and momentum once the roadways open, the sky’s clear, and we get intelligence from the people that were downrange and actually on the ground. What’s important with ICEYE, as mentioned earlier, ICEYE is not reliant upon airspace concerns.
EyeSight does not follow the same model that traditional aerial imagery and remote sensing follows. Having a constellation of satellites that are trained on our state while we’re being affected, it’s tremendous because we are gathering intelligence immediately after impact. We’re not deconflicting areas of interest to fly. We’re not waiting for the skies to clear.
We’re not waiting for airspace concerns to clear out. This information is being taken and delivered to us immediately. As it was mentioned that ICEYE will overlap their passes over our state, and they’ll refine those passes. Matter of fact, it it also mentioned earlier, the overall picture is still unfolding even after landfall.
So as water enters the watershed, it heads downstream. Some counties will face the worst after landfall. So while that’s happening, Eisai is recording that flood of record. So this is an incredibly important key part of our common operating picture.
What you’re looking at with this slide is a perfect setup for what you receive when you put together this operating picture. Off to the left, you’ll see some aerial imagery. You’ll see community there. We know that there’s a high density population there.
The imagery itself was taken from NOAA. NOAA is traditionally the first to fly after an event, giving us that extremely important critical piece of intelligence. Aerial imagery is and always will be one of the most important pieces of the puzzle, but it has limitations because of clouds and because of airspace concerns. Where Eyesight excels in those conditions.
They don’t have to worry about it. I can see that imagery. NOAA will stick closer to the shore, unfortunately. Right?
It doesn’t extend all the way inland. You know, at later times, we task out imagery and and we continue to collect. But eyesight gives us an idea about what happened within hours. Right?
So the blue polygons are actual eyesight flood extents. These are areas where water was detected, where water necessarily shouldn’t be. Right? It’s a comparison of where water was and where water wasn’t in a close time frame.
We also can zoom in on those polygons, and we can start to analyze what’s beside them, underneath them, who was affected by encroachment of water. You’ll notice you’ll see the purple icons of planes sort of going in different directions. Those are collection points from the civil air patrol, very close after landfall. And we had noticed in that concentration that there was an extremely large population of folks that really suffered some serious flooding impact.
It was unique. We were able to use those ICEYE flood extents and hone in on areas that we determined that were particularly problematic, which is incredible. You’ll notice that you don’t see any other imagery on this side because it hadn’t been done yet. Matter of fact, ICEYE flood polygons guide our decisions on where to collect imagery.
Not only are we using them for real actionable intelligence, but we’re also using them to make smarter decisions out in the field and collaborating with state, local, and federal partners in who’s gonna fly what and deconflict those areas. I think this really sums up why it’s important to have a geospatial based common operating picture so you can make these intelligent decisions. That’s really what I wanted to illustrate for the most part. Using ICEYE as this precursor to make decisions and actually and provide us a basis to make actionable intelligence and feed it through WebEOC.
That’s also feeding our assets and other critical information on top of each other. It’s just super important and testament to what this technology can do.
Next, I want to introduce Carolina Moran, who’s the chief of district resiliency, the division director for the flood control and water supply planning at South Florida Water Management District. So Carolina, take it away with some of your real world challenges and how ICEYE and WebEOC help to solve them.
Before I begin, just like to recognize our emergency operations center director, Richard Finbal. He’s also in the call today. Richard and the EOC team here lead all our emergency response coordination, including our collaboration with the county, other counties, and the Florida Division of Emergency Management. My focus here is complementary to this. It’s really how information collected during and after flood events can support long term resiliency planning.
I will focus on two primary applications. First, refining and calibrating our models, and second, straining the technical and economic justification for resiliency and flood mitigation investments that we have been prioritizing. So, the Water Management District South Florida has an extensive real time monitoring network across the sixteen county region, and for major events, we also collect high watermarks and other field observations. These sources provide valuable information about the overall conditions in our water bodies, areas we monitor, particularly via the infrastructure that we are operating on a twenty four seven. We manage every inch of water, basically, throughout system here in South Florida. This system is known as the Central and Southern Florida system.
So from a resiliency planning perspective, we need to understand also this flood extent and depth across a much broader area, including locations between these monitoring stations, right, between our infrastructure and mostly in areas that are normally dry. So beginning with Hurricane Ian, our planning teams, GIS teams, start using iSci products as an additional source of data. Our initial work focused on evaluating and validating these products and comparing to the water level data that we monitor, high water marks, photographs, and other available observations that we have here. But why are we doing all of that? What’s the core problem that we are really trying to solve here from a resiliency planning perspective? As I said, we have very strong information about water levels. We think canals, lakes, areas that we monitor over our water bodies.
But that information alone does not provide this comprehensive picture of overland flooding basin wide.
We explored previously satellite imageries, other sources, but they were fairly limited in terms of cloud cover, other storm conditions that impede, and I think both Daniel and John talk a little bit about that here. As a result, historically, we had less observation data in areas that are normally dry, in areas that we don’t have this granularity to collect the data. And precisely where is needed, right, to understand how water moves across the landscape, where flooding is affecting communities, and additional infrastructure. ISISAR technology really helps us in address this gap by giving this broader broader view of flood extent under those conditions, right, which would be limited by other types of imagery, would be limited by our own capacity to send people to the field, or even all the partnerships that we have around the region to collect data, flooded reservations.
So when combined with our monitoring network, all these data, fielded reservations that we get, iSight gives us a more comprehensive dataset to support resiliency planning in general. And so how do we use this? I’m gonna talk here about two examples here. First is model refinement and calibration and talk a little bit about that.
And hydraulic models that we have here in our agency are the foundation to assessing flood vulnerabilities to help us in adaptation planning. They help us understand current, future conditions, flood exposure, and risks in general, and really help us in determining infrastructure improvements.
However, the model is only useful if we have a strong ability to test against observed conditions and really monitoring data. As I said, we have water level gauges. We calibrate our models to that. But the flood extent and that information across this broader area that is now being provided through the ICEYE help us to evaluate whether the model is also accurately representing overland flow, all those equations that are really in the dry areas, and really help us to assess the full spatial pattern of the flooding.
When we compare water results with ICEYE data in high water marks, photos, and local observations, we can really see where the model performed well, where the assumptions and parameters might need some refinement. Better calibrated models, better substantiated with this data gives us greater confidence in all these efforts in terms of vulnerability assessment, adaptation planning, and really help us evaluate how those projects may perform or not under historical and current conditions, and also as we assess future changing conditions. All of that to also talk about my second example here, which is really funding justification.
Our agencies, I’m sure all the partners, all the local governments need to make choices about which resiliency, which flood risk reduction projects we need to advance. And those choices also require credible documentation on flood exposure, damages, benefits, potential benefits that a project is expected to provide. So having a more comprehensive flood extent and that data help us characterize this kind of baseline condition. Right?
Where flooding occur, how severe was the flooding, what communities, which facilities, what infrastructure, what critical assets were affected, and that information strengths the analysis on how we prioritize projects and evaluate alternatives. This is really important, especially when we are talking about cost benefit analysis supporting FEMA, FDM, hazard mitigation funding. The project sponsors need to demonstrate that the expected risk reduction from this project is comparable to the costs, and really, that is the manner to justify the proposed investment. So better observed data will support more defensive estimates of this existing putting risks and the avoided future damages provided by the projects that we are seeking funding.
This same principle applies to other ongoing army corps projects that we have on the flood risk management studies. Stronger datasets, observed datasets, helps establish a more credible technical basis to help us evaluate the alternatives and really justify those federal infrastructure investments that we have been negotiating with the Army Corps as well. In the state, we have Brazilian Florida program. We have local governments, also in us advancing flood vulnerability assessment, adaptation planning, project prioritization, same fashion.
Right? This connection really strengths the planning process and help justify funding requests through Resilient Forth program as well. I like that I’m adding this to the discussion here because this is really not just the operational response during the storm, but it’s really the ability to make better supportive decisions about the infrastructure investments to come back stronger under those future events. Right?
So how those projects should be prioritized, designed, and how these benefits are demonstrated to the partners. We have been working, as I said, since two thousand twenty two year. We incorporate all those observations into our repository, South Florida flood information resource. It helps preserve, characterize those flood observations and all the impacts across the region.
It does create a shared foundation that supports us all, our agencies, counties, municipalities, other planning partners. I also would like to recognize the partnership that we have with the Florida Flood Hub and Applied Research for Innovation. That partnership is currently really providing the pathway for our agency, all water management districts in the region, to access, evaluate, apply ISI information in support of resiliency planning. We really appreciate ISI’s support.
We are going to work on two initial exercises this year from a planning perspective, again, to improve the process of how we combine ice eye outputs with monitoring data, flood observations, photos, and other local sources, and share these derived products with local partners. Local water managers are critical partners in this effort. They can provide observations at a much more granular level than our regional agency can collect on its own. So really, geo located photographs detail information about also neighborhood scale flooding that can help us validate all of that with iSight and with our own dataset.
The more we show them that we have this database, the more the local governments will return back and see the value in us sharing this information and collecting this information overall. So that’s really our goal, to keep this engagement with the local government at a really high level. And that creates the reinforcing cycle. Right?
Better data, better local observations lead us to really better foot assessments, and better data and foot assessments will enhance our motor calibration, which will make stronger vulnerability assessments in our region adaptation plan, and then really providing a more credible basis for prioritizing projects and securing funding for implementation. So for me, this is really the long term resilience value of this information, converting those observations from actual flood events into better models, more defensible plans, better justify investments that will reduce the risk today and under future conditions in Florida.
So thank you.
Thank you, Carolina. I’d like to turn things over to Gretchen to give us a demo of iSci. Gretchen, please take it away.
Hello, everyone. We have been listening all about how our panelists have been using Flood Insight solution. And today, I want to just to take a couple of minutes just to show you what is included in that Flood Insight solution. At the iSide Flood Insight solution, it covers three different layers.
So when there is an event, either a hurricane or a big major flood event, we provide this analysis twenty four hours within the peak of the water and the flood. And we continue updating this data every twenty four hours until we don’t find any evidence of flood in our imagery. The first data layer that is included in the Flood Insight solution is our raster depth. This raster dataset that not only gives you the extents of the water, but also the depth of the water.
Each pixel will have the value of the depth. In this case, it’s twenty four inches. And with this data, that’s when you can do all the assessment that you saw in Lee County, during Milton, when you can understand what is the real impact of the flood. The second data layer that we provide is the extent of that water as a vector form, where you can use that in your GIS analysis.
An additional data layer that we add is a building footprint layer where we take the statistics from our water depth so you have right away, out of the bag, what is, like, the impact to local infrastructure in your dataset. The panelists also mention not only, like, the capabilities of EyeSight to monitor large areas. So for the purpose of this demos, I’m showing you zoom in. But for you to have an idea, this is how the real dataset looks like encompass the entire state of Florida.
For this particular event, which was Hurricane Milton. So every time that we provide flood inside product, you will make sure that we are trying to cover all the areas that are being affected. Doesn’t matter how big is the event, either through a single stay or multi state. Back to you, Jeff.
Excellent. Quickly, just want to talk about why ICEYE and WebEOC work so well together, why this integration is just great. First, you get twenty fourseven situational awareness. As Mike pointed out earlier, SAR monitoring works through clouds, it works through smoke, darkness.
When it matters most, SAR gets you the results you need, the data that you need. Rapid Impact Assessment is the second reason. High resolution imagery and analytics for flood, wildfire, hurricane, and hazard damage assessment. Automated data driven workflows is the third reason these two things work so well together.
They integrate directly with WebEOC. So automated alerts, proactive response, a single picture. You know, we like to say it’s one pane of glass where you can see your entire situation. Wide situational awareness, accurate situational awareness there.
And finally, global reach with local impact. ICEYE SAR constellation supports coordinated response anywhere in the world. So these two products just come together so nicely. You’re not leaving WebEOC to go to ICEYE. The data is right there, all in one picture for you. And I’m going to have Matt Cronin show us exactly how that looks within WebEOC.
So Matt, if you would take it away and show us the WebEOC integration with ICEYE.
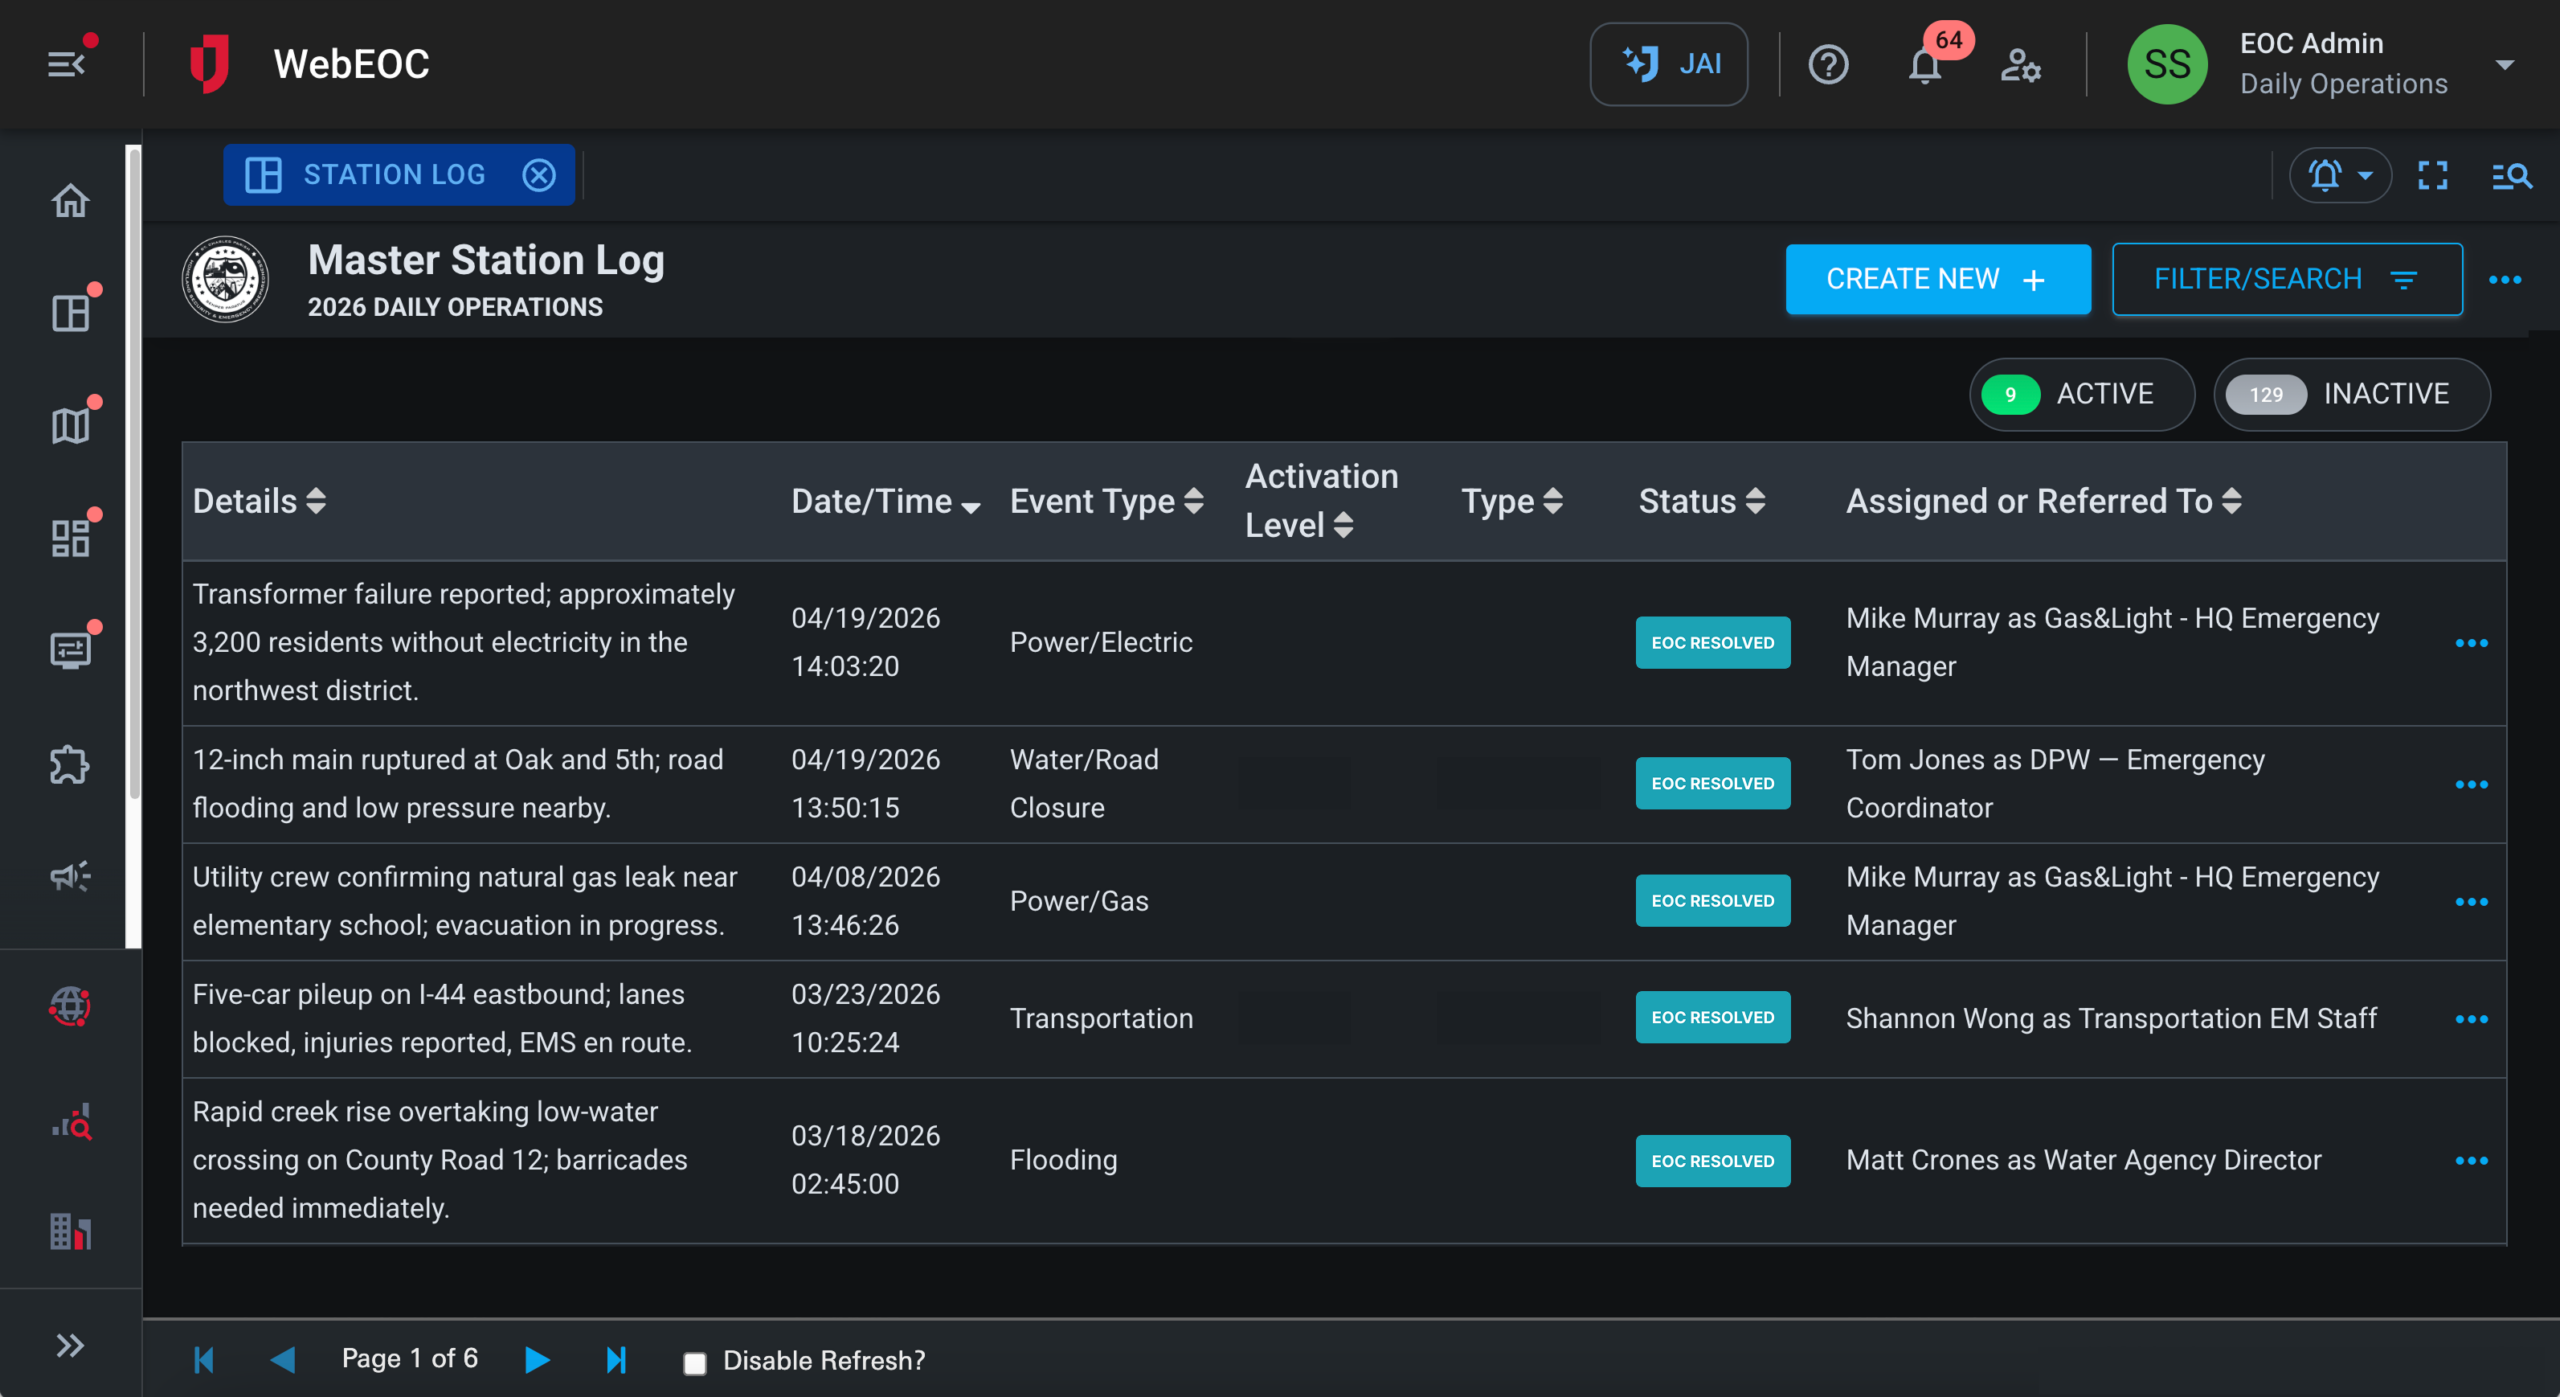
So real briefly, in WebEOC, as mentioned, several other folks here, obviously, they’re managing things like requests and situational awareness and sit reps and all that stuff. But this fills a really critical void in terms of that rapid impact assessment, virtual damage assessment, whatever term you wanna use, but essentially giving that insight into, as Gretchen mentioned, that critical information that you need and also that facility assessment. So you have individual layers. Those layers have legends.
These layers can be overlaid with other information in WebEOC. So you could have your critical infrastructure, your shelters, all of that information, as well as the depth, as well as the building assessments, which is huge. So this is really powerful during something like Milton, also not in Florida, but up in North Carolina. Helene is another example.
Jeff mentioned wildfires in California, the Palisades. Some really powerful data that Eyesight is able to provide in terms of that rapid assessments. And being able to overlay that in WebEOC just really provides a critical capability for our clients. So it’s great to see those that have adopted it and are taking advantage of this really modern technology.
That’s all I had. Just wanna quickly show it that our configured ArcGIS layers that are configured within WebEOC maps. Thanks, Matt.
What I’d like to do next is just turn things over to Mike for the panel discussion in-depth here with these experts on the call.
So, Mike?
I wanna start on the operational side, and so I think this is probably more for John and Daniel.
Florida is obviously no stranger to hurricanes, most recently with the three storms in twenty twenty four with Debbie and Helene and Milton. So I’d like to talk through how the use of Flood Insights and WebEOC changes that situational awareness picture. In that first twenty four to forty eight hours where you’re trying to just get visibility on what’s happening, How does the power of these two tools really fill in gaps for you today?
No. Great questions. Here at FDM, I suppose everybody manages their instance of WebEOC a little bit different. We have a dedicated WebEOC administrator who’s also our current deputy CIO in the division, Colby Maxwell.
He’s been at developing and keeping up with the technology trends with WebEOC for quite some time. He has a lot of experience under his belt. But I think what Colby brings to the table is this seamless sort of integration with GIS. He literally is almost embedded with us or we’re embedded with him.
We just work extremely close with one another. So I wanna throw that out there. Because of his understanding of GIS, his ability to create new layers and pivot and feed new things that GIS brings online from eyesight and from other intelligence that we gather, it really gives us a tremendous edge. And I don’t see without that institutional knowledge that Colby has, I mean, how we could pull it off.
WebEOC allows us to instantaneously deliver analysis products. That can be before the storm even hits. We could be looking at the National Hurricane Center’s potential surge or p surge using that as a basis to kinda get an idea on what might be happening on the surge component. But WebEOC just marries all of this data with eyesight and the building footprints just to further enhance that.
The building footprint analysis with the depth is amazing. The other thing that I wanna underscore is the size of the response, you know, for a state like Florida. At EFDAM, we got a modest GIS force. We’re small, but we’re pretty mighty.
We get a lot of experience doing what we do. Our battle rhythm continues from event to event, but then it’s augmented by all these new tweaks and updates with technology and WebEOC, and we all keep up with that as things go on. But WebEOC just gets us to a place where we can share things more effectively, but it’s not only a sharing mechanism, it also the mechanism that we utilize to marry disparate datasets or they what they were what would be. When people are entering WebEOC missions and indicating in on forms that COLB maximize that COLB authors and allows our different emergency support functions to enter information pertaining to what they’re doing in the response.
You know, WebEOC is like a live feed to all the underpinnings to what’s going on in this response. It’s pretty amazing, really. When we build a web application with eyesight that produces intersects with structures that we know are either residential, commercial, industrial, you know, we know how many homes and how deep that water can be potential areas. You know, that all is packaged and accomplished in one way or another through innovative technology, eyesight coming online almost immediately after a storm, and then WebEOC being able to connect with a feature layer to let the eyesight data speak, it really gives it a third sort of dimension and provides fantastic results.
And just so you can get like a peek behind the curtains, what we might do in a case like with what we see with those footprints, we will actually extract those structures and attach those values and then we’ll put together spreadsheets or other table products. You know, analysts can sum and they can sort, they can provide further information using their expertise. It doesn’t just live in a really cool looking map because it is. They are flood and death grids, flood extents.
They’re really powerful, but we also enrich all that. We use all that technology to produce the tabular data that ends up going in briefing slides and reports and goes up to the governor’s office. We can provide that immediate look where we have estimations based on what happened in a very quick manner.
John, if you wanted to add anything or if there’s anything to add to that?
In the EOC, the currency is real is real time information. We’re receiving information, and we’re looking at things. And, in this EyeSight product, all the things that Daniel pointed out and Carolina pointed out, I mean, we use that to ground truth, and we don’t wanna put first responders in harm’s way, obviously. But then having that other tool in the toolbox is is vitally important for us to make real decisions.
So, Carolina, I know we were talking about the first twenty four to forty eight hours here with John and Daniel from the response side. But obviously, as you spoke about, there’s use of the data that extends well beyond that. So how does this change how South Florida Water Management District thinks about pre event planning and then mitigation and resiliency?
We begin at the event. Right? We also have the WebEOC activity that we are there managing what levels, opening gates, closing gates, and achieving targets as a response in terms of real time information. So the results, everything covered here by John and Daniel are also being benefited by the ability to have this information right there at the time to help inform our operations.
South Florida, the levels are managed at this central location. And a lot of those communities, the management of the water management system itself can alleviate and re prepare for those events. And then as we go to the event and we start assessing areas of vulnerability that could be potentially tied to infrastructure, we always wanna be able to enhance infrastructure and bring better capacity to move water when needed, to store water when needed, and to respond to those events. In the future, having more tools.
The ability to have these images to help us assess this post event, where we have seen that the system can perform better or we can add additional features that will enhance our capacity to respond and to manage levels better, we will definitely use those informations. By having this ability to comprehensively evaluate impacts. Right? Where are the damages?
Where we are seeing those impacts? And tied to the operation and tied to an infrastructure need really helps us in terms of how we can have a system responding to the best possible to those events in the future. And again, all depend on funding. Even when we are talking about increasing capacity, enhancing the system, building resiliency, those investments are not cheap.
We depend on funding. And having this type of information to really help us document damages is key. The math is there. You have to do a cost benefit analysis.
You have to show that what you’re bringing in terms of investments to protect the communities are going to be important and are going to be less than those damages that occur right now in the past event or that we can project to occur in the future. I think an image is valued a ton of words, and I think in this case, it’s here the same. The more comprehensive we can be in terms of documenting those damages, the more capacity we and all our local partners will have in terms of really justifying those investments.
Appreciate that. And I know we’re running short on time. So I just wanted one more question in, let’s say, twenty seconds or less from each of you if you could answer. We’ve got folks that are on this webinar who are emergency management officials, who are resiliency officials, who kind of run the gamut of government workers that look at flood and need to understand flooding data and operate in a way where they need to inform their constituents and their stakeholders about how a flood is evolving.
Give folks on this webinar just one final piece of advice about how to integrate data like this and how to integrate WebUC into their operations or integrate ICEYE into their operations?
What may that be?
I think you definitely have to lead with the technology that’s out there. Public safety, we’re leaders for the community. The community relies on us. And if you’re not adopting adopting technology, these tools, and some others that I’ve mentioned, you’re really being left behind because you’re gonna be called on the carpet before it.
Yeah. That’s a good point, man. For sure. If I could provide one piece of information, I would say folks utilize other datasets in conjunction, push creative things, informative things.
Use WebEOC to highlight, post, create attention to products that you’re making. Derivatives, I think, is the best way to put it. We wanna create derivatives. We just don’t wanna use iSide by itself.
Every single county, community, they everybody has, like, a unique case. And what is that? We wanna create derivatives that speak to that flood extent. What’s that flood extent affecting?
And also, don’t forget about utilizing your parcels. We are tremendous fans here of parcels. One of our analysts, Samantha Strang, she came from a parcel mapping background. That’s where I came from.
Parcels are extremely powerful. It is extremely authoritative data if you can imagine that. It’s the backbone of a county’s finances, really. Right?
This is information that a lot of it is vetted annually. It is visited in person. It is a very and thorough way to understand what type of structure it is. How much is that structure worth?
Who do you contact? There’s just a lot of great information with parcels that can help enrich a lot of these products. You can make some really actionable good intelligence with them.
I think the power of all of those tools is really coordination, facilitating coordination, facilitating this regional perspective. I mean, we are talking about events that can be regional in nature that are impacting many areas, having the ability to look and respond to your community and also understand what’s happening in the communities around you is gonna be key here.
Thank you all very much. Listen. There’s a bunch of questions that we didn’t answer. We’re actually out of time.
So Wade, Benjamin, Veronica, Bob, if you have any questions for me or for Mike Bennett or you wanna learn anything more about what we talked about today, our website or you can go to our website, of course, ice eye dot com or Juvare dot com. But you can also email me or Mike directly, and we can answer your questions for your more information. Thank you all for attending. This is a great event.
We appreciate your participation.