In 2021 alone, the U.S. nearly broke a record for the number of natural disasters that struck the country, including four tropical cyclones, two mass flooding events, three outbreaks of tornados, a drought, and wildfires across much of the western part of the country. While it is impossible to predict exactly when or where a natural disaster is going to hit, with FEMA’s new National Risk Index (NRI), emergency managers, decision-makers, and other Juvare clients have a useful tool to estimate the potential damage. Armed with FEMA’s risk index, you can present actionable data to support emergency management protocols and support requests.
How FEMA’s National Risk Index Supports Preparedness and Emergency Management
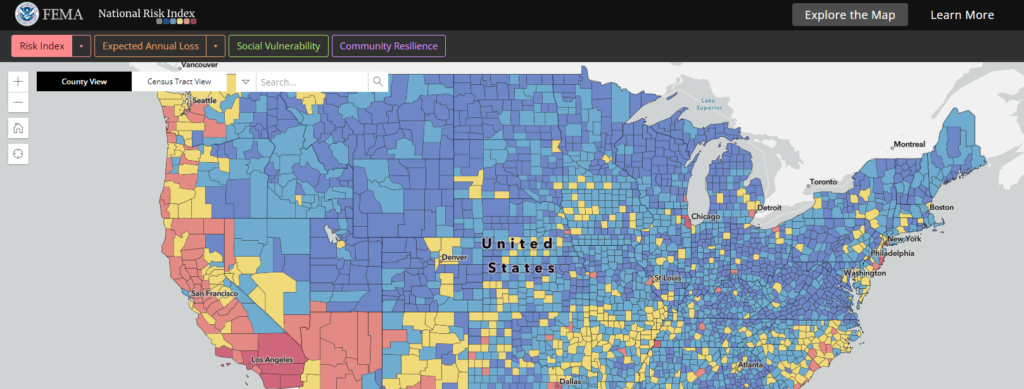
The NRI consists of a detailed, interactive map that breaks the United States down, county by county, providing a detailed visualization of the impacts each area is likely to face due to specific natural disasters. Using the tool is straightforward. You choose the disaster you are interested in exploring, then zoom in on the area of the country you want to focus on. You can also use the map to get a general overview of the overall risk from all natural disasters associated with a specific area.
Each disaster has its own color-coordinated legend that gives you insight into whether the expected annual loss in a particular area is going to be very high, relatively high, relatively moderate, relatively low, very low, or if there are no expected annual losses. There are also colors telling you whether there’s insufficient data to perform an analysis or if the disaster is not applicable to the area.
With FEMA’s tool, you can click and tap your way to the kind of data you need to better prepare for a disaster to improve response and resiliency. For example, the National Risk Index:
- Helps people think through disasters that are not always top-of-mind.
- Gives you the information you need to make data-driven strategic investments to aid preparedness and recovery, such as purchasing additional salt trucks for areas where snow or ice storms tend to have a significant impact.
- Educate renters and homeowners regarding how to safeguard their physical assets and protect their families.
How the Social Vulnerability and Community Resilience Factors Work
The tool builds a more accurate assessment of risk by layering accurate historical information that impacts the risk of loss with the social vulnerability and level of community resilience associated with each region. These combined inputs provide a better overall assessment because they take into consideration factors beyond dollar amounts.
Daniel Kaniewski, former Deputy Administrator for Resilience at FEMA and Juvare Advisory Board member, explains, “Mitigating hazard risks is far more difficult for at-risk communities. They may have the same high-hazard score, but the tool also combines this with the community resiliency factor and produces a score that factors in these things to produce a more comprehensive, accurate risk assessment for the area.”
Social Vulnerability
The social vulnerability factor measures the socioeconomic fragility of each community. This is then factored into the risk index’s formula:
Risk index = Expected annual loss x Social vulnerability / Community resilience
The more likely a county is to have socially vulnerable demographic groups, the higher the coefficient associated with this factor.
For example, Washington County in Maine has a social vulnerability score of “Relatively High” because its score of 49.15 is almost 23% higher than that of the Maine average of 40.13. Therefore, a disaster is likely to have more of an impact in this part of the state.
Community Resilience
Community resilience measures how well a community has been able to rebound from a disaster. The stronger a community’s resilience, the higher their score. Consequently, in the NRI’s formula, the product of expected annual loss and social vulnerability gets divided by the community resilience component. As a result, decision-makers get a more accurate estimation of what a specific area will need if they are impacted by an incident.
Returning to the Washington County example, a click of the mouse reveals that the area’s community resilience is “Relatively High” after they have been struck by a disaster. Even though their social vulnerability is relatively high, so is their resilience, which serves to offset their vulnerability score. So even when it comes to a likely disaster such as coastal flooding, Washington County’s overall risk level is “Relatively Low.”
Using FEMA’s National Risk Index for Hazard Vulnerability Analysis
When performing hazard vulnerability analysis (HVA), FEMA’s tool makes the process faster and the results more compelling. The National Risk Index can play a significant role in HVA, particularly for decision-makers and those in charge of formulating action plans. For example, an emergency manager may use the NRI to demonstrate to their director why certain tools are needed. The NRI enables emergency managers to explain what they need and use data to justify any expenditures and action steps.
To illustrate, suppose you are a disaster manager in San Francisco, which is in California’s Alameda County. While the decision-makers you report to may be well aware of the risk of loss associated with earthquakes, the risks connected with drought may not top their list of concerns. However, the National Risk Index indicates Alameda has a relatively high risk of severe economic loss due to drought.
You could then use this data to prepare for:
- Wildfires that may result from dryer-than-normal conditions.
- An increase in insect infestations and plant-based diseases, which often occur due to drought, and can impact both agriculture and general plant life.
- Possible community health and economic issues stemming from reduced availability of water.
Kaniewski notes that as an emergency manager, you can use FEMA’s NRI to “tailor your preparations based on your risk. It can inform your plans, help you establish resources that can be distributed after a disaster, and allocate resources according to need.” In addition, this tool can be used as an educational resource for community members as well, who can use it to direct their efforts towards minimizing the impact of hazards on their personal assets.
The National Risk Index also plays a critical role in helping organizations take a preemptive approach to hazards, enabling them to prevent financial fallout. As Juvare Client Success Manager Bryan Hovde points out, “Emergency management should be seen as an organization’s insurance policy because it can save them millions every hour.” Hovde outlines specific examples of solutions the tool can underscore a need for, such as:
- Redundant telemetry systems for hospitals.
- Cloud-hosted, redundant systems that can be spun up when your primary digital infrastructure fails during a disaster.
- Redundant power systems you can use to run your operations if you lose your main power source.
Using the NRI to make the case for tools such as Juvare’s solutions can position an organization to take a proactive stance, avoiding extended downtime and financial loss, allowing you to get a step ahead of disasters. This will ensure your organization or community is prepared to minimize the impact of an event—long before it happens.